
Gasoline Wrote Most of September's Retail Gain. Import Buyers Should Not Read It as Demand.
Gasoline stations accounted for 71 percent of the $5.7 billion rise in U.S. retail receipts in September, while real employee earnings fell 0.5 percent and the retail grouping that carries most holiday merchandise was nearly flat. That does not show import demand falling.

Gasoline stations accounted for 71 percent of the $5.7 billion rise in U.S. retail receipts in September, while real employee earnings fell 0.5 percent and the retail grouping that carries most holiday merchandise was nearly flat. That does not show import demand falling. It shows the headline cannot tell a buyer whether demand is rising. Abroad, export-hub labor data point to divergence rather than a common shortage, and AI's employment effect remains unmeasured.
Research window October 13–19, 2026 (cutoff 12:54 CDT, October 19). Observations are mainly September and third-quarter 2026; older baselines are labeled where used.
Executive Takeaway
The U.S. retail report released on October 15 looked like resilience: receipts at retailers and restaurants rose 0.8 percent in September, to $745.0 billion. The composition supports something narrower. Gasoline stations supplied $4.07 billion of the $5.70 billion increase, or 71.4 percent. Outside gasoline stations, receipts rose 0.24 percent. A Census grouping that approximates the National Retail Federation's holiday definition, excluding vehicle dealers, gasoline stations and restaurants and covering about 60 percent of all receipts, rose $296 million, or 0.07 percent. In the same month consumer prices rose 0.6 percent, gasoline prices 9.1 percent, and real average hourly and weekly earnings each fell 0.5 percent.
The Meridian's reading is that September's nominal strength came largely from gasoline-station receipts, and that it provides no evidence on the breadth of real, import-relevant demand in either direction. The timing makes the distinction commercially important. Holiday replenishment and first-quarter supplier commitments are being sized now, and a buyer who treats headline retail growth as a proxy for unit demand is, this month, mostly measuring what was spent at gasoline stations.
The evidence does not support the opposite story either. Furniture and electronics stores posted nominal gains, real consumer spending rose 0.6 percent in August, revolving credit fell in August, JPMorgan's card charge-off rate declined even as early delinquencies edged up, and NRF still projects 4.2 percent holiday growth. Two credible furniture measures point in opposite directions, and public data cannot reconcile them. The defensible position is uncertainty about breadth. The commercial response is to carry that uncertainty in order timing and contract flexibility rather than in a directional demand forecast. Import prices sharpen the problem from the cost side: nonfuel import prices rose 6.0 percent over the year, so importers' purchase prices are rising while unit demand goes unobserved.
Outside the United States, the labor evidence argues against two popular narratives. China, Mexico and Vietnam do not show a synchronized factory-labor shortage. China's manufacturing employment index fell to 48.4 while production rose; Mexico's manufacturing employment fell 1.0 percent over the year as real pay rose 2.7 percent; Vietnam added workers while youth unemployment increased. The Federal Reserve's October Beige Book records AI-related attrition, delayed hiring or expected slower job creation among contacts in five districts, while a Dallas staffing firm reported adding recruiters to review AI-generated interviews. That is evidence of task reorganization in specific roles, not measured national job loss. Rising participation among older workers and women across the OECD shows that population aging does not translate mechanically into fewer available workers.
The first hard test arrives October 29, when the Bureau of Economic Analysis publishes September income and spending. The Meridian expects real disposable personal income to show no gain for the month (see Calls to Audit).
Editorial Analysis
Receipts Are Not Units: September's Retail Gain Is a Weak Basis for Holiday Orders
On October 15 the Census Bureau reported that U.S. retail and food-service sales rose 0.8 percent in September, to $745.0 billion from a revised $739.3 billion in August1. The headline suggested resilience heading into the holiday season. The detail tables support a narrower reading. Gasoline-station receipts rose from $63.95 billion to $68.02 billion, an increase of $4.07 billion that accounts for 71.4 percent of the total monthly gain. Excluding gasoline stations, receipts grew 0.24 percent, which the release rounds to 0.2 percent. Over twelve months the effect is smaller but still out of proportion: gasoline stations account for about 9 percent of receipts but supplied 34 percent of the $44.1 billion annual increase, and their share of all retail receipts has risen from 7.6 percent in September 2025 to 9.1 percent.
Exhibit 1. Gasoline stations supplied 71 percent of September's nominal retail gain
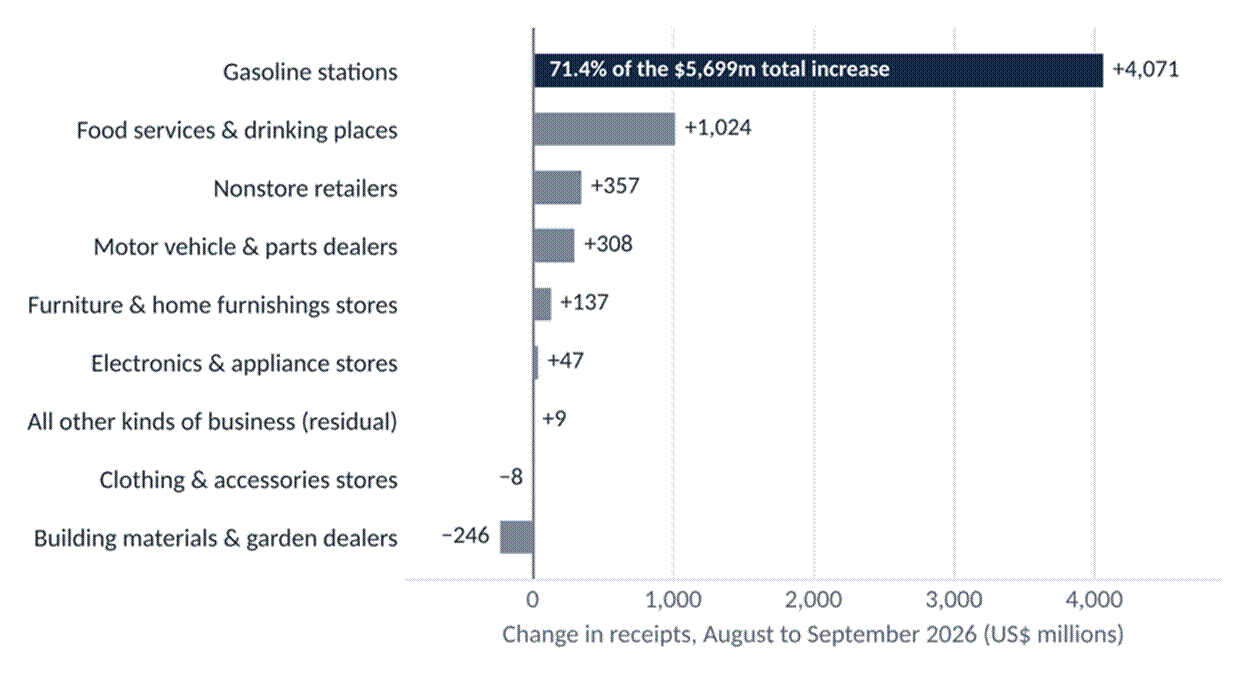
Change in receipts by kind of business, August 2026 (revised) to September 2026 (advance), US$ millions, seasonally adjusted and not adjusted for prices. Total change $5,699 million. “All other” is the residual for kinds of business not shown. Receipts are dollar sales, not product quantities. Source: U.S. Census Bureau1; Meridian calculations.
The concentration is sharper in the part of retail through which imported holiday merchandise moves. Remove motor vehicle and parts dealers, gasoline stations and food services, which approximate the categories NRF excludes from its holiday forecast, and the remaining 60 percent of receipts rose by $296 million, or 0.07 percent. That is well inside the sampling error the Census Bureau attaches even to its headline estimate, a 90 percent confidence interval of plus or minus 0.4 percentage point1. The grouping is a Meridian construction, not an official series, and it includes building-material dealers, whose receipts fell 0.6 percent; excluding those as well, the remainder grew 0.14 percent. On either definition, the merchandise channels that matter most for holiday imports were close to flat in nominal terms before any adjustment for prices.
The gap between the headline and the detail opened in a month of sharp energy price increases. The consumer price index rose 0.6 percent in September, with gasoline up 9.1 percent and the energy index up 5.2 percent, against 0.3 percent for prices excluding food and energy2. Average hourly earnings for private-sector employees rose five cents, to $37.81. In constant dollars, hourly earnings fell 0.5 percent to $11.24, weekly earnings fell 0.5 percent to $386.76, and real hourly earnings were 0.7 percent below a year earlier3. These are averages for employees, not measures of household income, which also includes transfers, investment income and the earnings of people whose jobs or hours changed. They establish that the average paycheck bought less in September. They do not establish that household spending capacity fell by the same amount.
Receipts by kind of business are an accounting of where money was spent, not a count of goods. Gasoline-station receipts rose 6.4 percent in a month when the gasoline price index rose 9.1 percent, but the two cannot be combined into an estimate of gallons sold: stations sell convenience goods as well as fuel, and the price index tracks what consumers paid rather than what stations collected. The same limitation runs through the categories importers care about. Furniture and home-furnishing stores reported a 1.3 percent monthly gain and electronics and appliance stores 0.6 percent, while clothing stores were flat and building-material dealers fell 0.6 percent1. Prices in related categories moved in different directions: the CPI for appliances fell 0.7 percent, televisions 1.9 percent and household furnishings and supplies 0.2 percent, while apparel rose 0.3 percent2. Falling goods prices alongside rising receipts could mean more units sold, but the store categories and price indexes do not map closely enough to compute it. Census also reports median monthly standard errors of 1.7 percentage points for furniture stores and 1.1 for electronics stores, larger than most of the movements themselves.
Exhibit 2. Store receipts by category moved in different directions, and so did related prices
|
Kind of business |
Aug–Sep change (%) |
12-month change (%) |
Median monthly std. error (pts) |
Related CPI, Sep monthly change
(%) |
|
Total retail and food services |
0.8 |
6.3 |
±0.4 (90% interval) |
All items +0.6 |
|
Gasoline stations |
6.4 |
28.1 |
n.r. |
Gasoline +9.1 |
|
Total excluding gasoline stations |
0.24 |
4.5 |
n.r. |
— |
|
NRF-comparable grouping (Meridian) |
0.07 |
4.6 |
n.r. |
— |
|
Furniture & home furnishings stores |
1.3 |
4.9 |
1.7 |
Household furnishings & supplies −0.2;
furniture & bedding −0.8 (NSA) |
|
Electronics & appliance stores |
0.6 |
9.4 |
1.1 |
Appliances −0.7; televisions −1.9; computers
& peripherals +1.4 (NSA) |
|
Clothing & accessories stores |
0.0 |
5.0 |
0.9 |
Apparel +0.3 |
|
Non-store retailers |
0.3 |
8.2 |
0.3 |
— |
|
Building materials & garden dealers |
−0.6 |
4.5 |
n.r. |
— |
|
Food services & drinking places |
1.1 |
7.0 |
n.r. |
— |
|
Motor vehicle & parts dealers |
0.2 |
2.6 |
n.r. |
New vehicles +0.2; used +0.7 |
Percent changes are Meridian calculations from Census levels (US$ millions, seasonally adjusted, not price-adjusted). The NRF-comparable grouping is total sales less motor vehicle & parts dealers, gasoline stations and food services & drinking places; it approximates, but does not exactly match, NRF's holiday definition. Standard errors are those Census reports for monthly change estimates; n.r. = not reproduced in the research. CPI changes are seasonally adjusted unless marked NSA. CPI categories do not map to store categories and are not usable as deflators. Sources: U.S. Census Bureau1; BLS2.
Where an independent measure exists, it disagrees. Census data put furniture and home-furnishing store receipts 4.9 percent above September 2025. The CNBC/NRF Retail Monitor, which draws on roughly 120 million debit and credit cards, reported its furniture and home-furnishings category 2.7 percent lower over the same period4. The two do not measure the same thing. The Monitor assigns store-based online sales to merchandise categories, and September was the first month of a redesigned methodology that NRF says is not directly comparable with its earlier figures. Neither number is wrong on its own terms, and averaging them would produce a figure that describes nothing. For a furniture importer, the practical lesson is that public data cannot currently settle whether the category is growing. Order decisions need the customer's own sell-through and open-to-buy, not either headline.
One tempting explanation for strong sales and weak wages is that households borrowed the difference. The available data do not support it. Revolving consumer credit fell to $1,352.4 billion in August from $1,357.2 billion in July, a 4.2 percent annualized decline, while nonrevolving credit rose5. Real personal consumption rose 0.6 percent in August with real disposable income unchanged and a saving rate of 4.1 percent6. Those are August figures; September financing data are not yet published, and because receipts, employee earnings and credit balances cover different populations, subtracting one from another does not measure borrowing. JPMorgan's card business shows the ambiguity in a single portfolio: its 30-day delinquency rate rose six basis points from the second quarter to 1.97 percent, while its net charge-off rate fell 43 basis points to 2.91 percent, and both were lower than a year earlier7.
The strongest counterargument is that demand is healthy and the gasoline effect is a pricing quirk. It has real support. August's 0.6 percent rise in real spending was solid, furniture and electronics stores grew, JPMorgan's card sales volume rose 9.2 percent over the year, and NRF forecasts holiday sales growth of 4.2 percent to $1.013 trillion, with 325,000 to 375,000 seasonal hires against an estimated 356,000 last year6,7,8. The Meridian accepts that these facts argue against a broad collapse. They do not establish breadth. NRF's forecast is a trade-association projection that already excludes gasoline, and on September's data The Meridian's approximation of NRF's grouping was running 4.6 percent above a year earlier. The comparison is indicative, since it sets one month's annual rate against a two-month forecast, but a 4.2 percent holiday outcome would be a modest nominal slowdown, before accounting for higher import prices. Card volume at one issuer reflects that issuer's growth and customer mix. The case for strength rests on August spending and on forecasts. The case for caution rests on September's composition and real earnings. Neither has yet been tested against real spending by category.
Import prices add a second reason to separate value from volume. The BLS import price index rose 1.1 percent in September and 8.1 percent from a year earlier, led by fuel, which was up 34.5 percent over the year. Nonfuel import prices still rose 0.7 percent in the month and 6.0 percent over the year, and prices of imported consumer goods excluding autos rose 0.4 percent and 2.7 percent9. These indexes are not seasonally adjusted and do not capture tariff treatment, retail pass-through or quantities. They do mean that the dollar value of imported merchandise can rise without more units moving, and that importers face higher purchase prices at the moment their customers' real earnings are falling. Because the indexes exclude duties and freight, they do not capture the full landed cost. Whether those costs are absorbed in margins or passed to shelf prices will determine how much of the squeeze reaches unit demand. That pass-through has not yet been observed.
Exhibit 3. Fuel dominates import inflation, but nonfuel and consumer-goods import prices are also higher
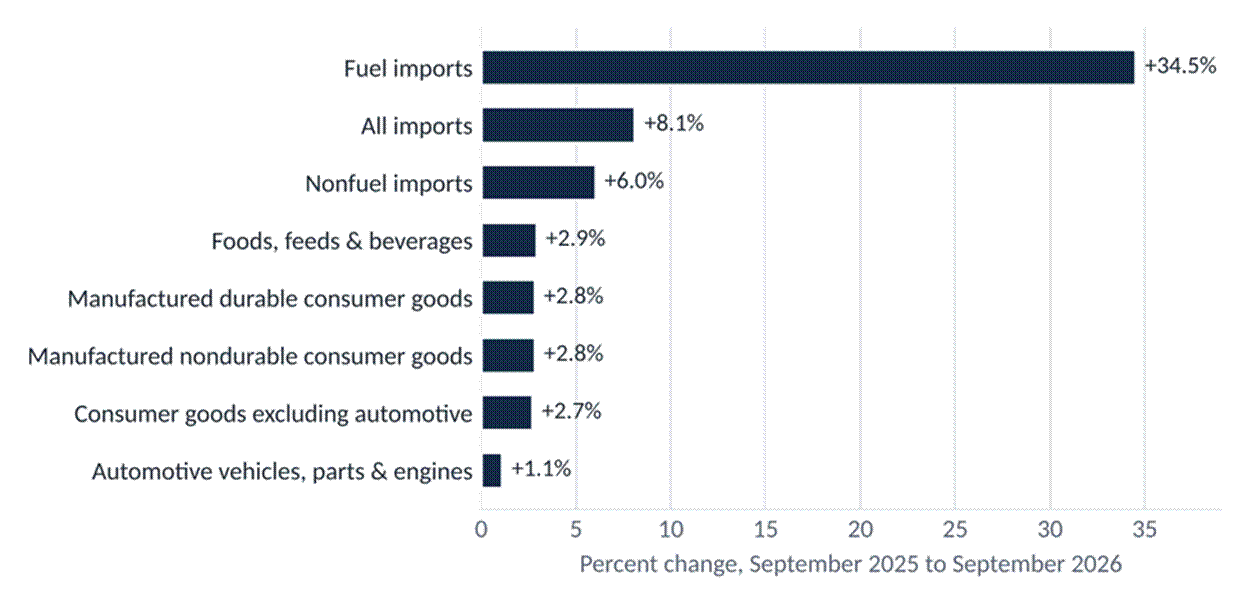
U.S. import price indexes by end-use category, percent change September 2025 to September 2026, not seasonally adjusted. September monthly changes: all imports +1.1%, fuel +4.8%, nonfuel +0.7%, consumer goods excluding automotive +0.4%, manufactured durable consumer goods +0.7%. Prices only: the indexes do not measure quantities, tariff treatment or retail pass-through. Source: BLS9.
The commercial consequence concerns method more than direction. Importers, buying teams and their suppliers should not raise holiday or early-2027 commitments on the strength of headline retail growth, because this month the headline gain is mostly gasoline-station receipts. Nor should they cut on the strength of falling real earnings, because household income, spending and credit data do not yet show a contraction. The useful work is to rebuild the demand signal from units: category sell-through and weeks of inventory from customers, confirmed purchase orders rather than forecasts, and price-adjusted plans that distinguish a 3 percent increase in unit cost from a 3 percent increase in volume. Order timing can carry the uncertainty through shorter commitment windows, staged releases against confirmed sell-through, and supplier terms that preserve flexibility until the November data arrive.
This assessment would be proved wrong, usefully, if BEA's September data on October 29 show real goods spending rising broadly outside energy, if the October retail report on November 17 shows ex-gasoline growth spread across merchandise categories, or if retailers report stable or rising orders against lean inventories. A sharp fall in gasoline prices would also change the picture by returning purchasing power to households, though it would mechanically depress nominal receipts at the same time, which is the same measurement problem in reverse. The Meridian's horizon for this view is the next 30 to 90 days, covering the bulk of holiday replenishment.
Demographics, Labor & Consumption — Fixed Intelligence Coverage
01. Population Growth, Aging & Demographic Transitions
Status: Monitoring continues. Coverage incomplete for manufacturing-hub cohorts.
No new demographic revision was established in the research window. The most recent official releases reviewed provide baselines rather than news. Eurostat reported on October 6 that people aged 20 to 64 made up 58.3 percent of the EU population on January 1, 202510. Japan's September population estimates put the total at 122.65 million on September 1 (provisional), 0.54 million fewer than a year earlier, and its final April 1 detail shows the more consequential shift taking place inside the older population11.
Between April 2025 and April 2026, Japan's population aged 15 to 64 fell by 222,000, to 73.336 million. The population aged 65 and over grew by only 19,000, to 36.211 million, but those aged 75 and over rose by 479,000, to 21.531 million. By subtraction, the 65-to-74 cohort shrank by about 460,000. The headline count of older residents is nearly flat while people are moving quickly out of the ages at which many still work and spend on travel and durables and into the ages that drive health-care and care-service demand. The conventional ratio of residents aged 65 and over to those aged 15 to 64 is 49.4 per 100; that is an age convention, not a count of dependents per worker.
Exhibit 4. Japan's older population is shifting from ages 65–74 to 75 and over
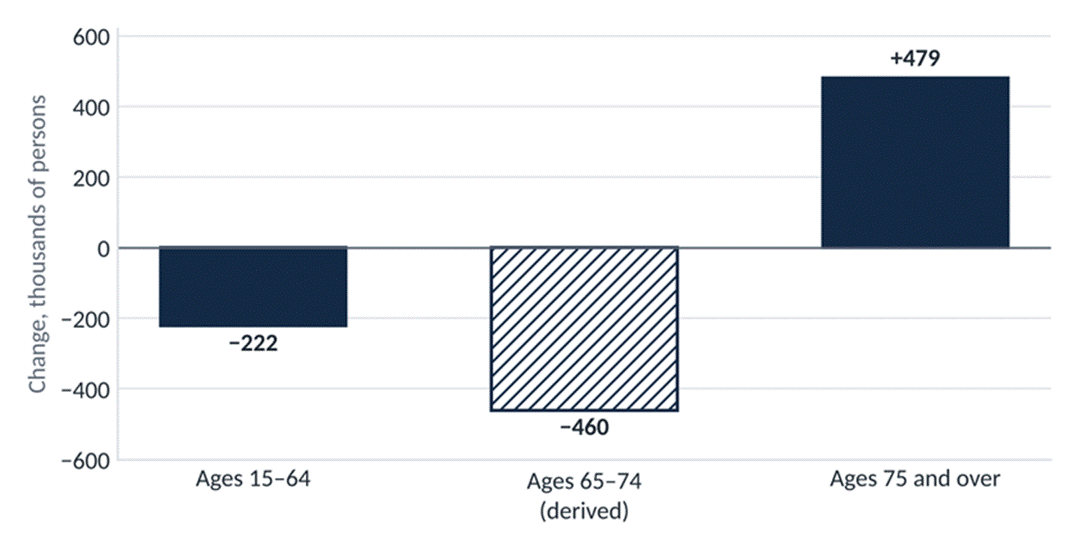
Change in Japan's population by age group, April 1, 2025 to April 1, 2026 (final estimates), thousands of persons. Ages 65–74 is derived as the change in ages 65 and over (+19,000) less the change in ages 75 and over (+479,000); the hatched bar marks the derived value. Estimates from October 2025 onward will be revised to the 2025 census benchmark. Source: Statistics Bureau of Japan11; Meridian calculation.
What matters to employers is the labor actually available rather than age structure alone, and the OECD's latest data show participation rising among older workers (see 03). Consumer businesses in Japan face a different planning problem: demand shifts with transitions inside the older population, so treating everyone over 65 as one market misses the move from the 65-to-74 group into the 75-plus group. Two cautions apply. Japan's estimates from October 2025 onward will be revised to the 2025 census benchmark, and a low working-age share in an EU region can reflect a large number of children rather than aging10,11. Japan's October report is due October 2012. The research did not reconcile working-age cohorts, commuting populations or retirement flows for specific manufacturing hubs, so no conclusion about demographic constraints on particular export clusters is offered here.
02. Migration, Urbanization & Labor Mobility
Status: Material claims requiring further verification: launch verified; labor-supply effect not established.
The week's one new development is a program, not a measured flow of workers. On October 14 in Manila, the ILO, Australia and Switzerland launched a partnership for fair and effective labor migration in ASEAN, with roughly US$20 million in announced funding for April 1, 2026 through March 31, 203113. It covers regular migration pathways, skills recognition, worker protection, portability of benefits and reintegration. Listed country activities cover Cambodia, Indonesia, Laos, Malaysia, Myanmar, the Philippines, Thailand and Timor-Leste. Vietnam is not among them, so the program should not be read into Vietnamese export-hub staffing.
Its commercial relevance lies in the friction it targets. Employers recruiting across ASEAN borders pay repeatedly for credential checks, recruitment fees and onboarding when qualifications do not transfer. Recognized skills and usable legal pathways could widen accessible labor pools, but only once recognition decisions are made, pathways are used and placements are retained. A launch and a budget do not add workers. The Swiss development agency's project record corroborates the objectives but dates its phase from March 1 rather than April 1, and the outcomes it describes belong to a predecessor project, not to this one14.
China's National Bureau of Statistics reported 192.70 million rural migrant workers at the end of the third quarter, 0.4 percent more than a year earlier15. That is a stock of workers employed away from their rural registration, not a net flow, and it says nothing about whether particular export plants can recruit the skills they need. In the United States, Boston Fed contacts attributed some hiring difficulty to immigration enforcement and to aging16. Those are contact attributions; the research obtained no enforcement data, worker-exit counts or local housing and commuting evidence to test them. The indicators that would show real mobility are recognition decisions, work authorizations against actual starts, recruitment fees, and placements and retention by corridor.
03. Employment, Unemployment & Labor Participation
The broadest new evidence is the OECD's harmonized second-quarter release, published October 15. Across member countries the employment rate for ages 15 to 64 rose to 70.4 percent from 70.3 percent, and participation held at 74.2 percent at published precision17. The composition says more than the totals. Women's employment and participation each rose 0.2 percentage point, and employment among people aged 55 to 64 rose 0.4 point, with their participation up 0.2 point. Higher participation among older workers and women is offsetting part of the pressure that aging puts on available labor. Aging still matters, but its effect on available workers runs through participation decisions that employers can influence through retention, scheduling and benefits.
The export-hub picture is uneven rather than uniformly tight. Mexico's harmonized employment rate was 63.2 percent, unchanged from the first quarter and slightly below a year earlier, while participation slipped to 65.0 percent from 65.1 percent17. Vietnam's labor force grew by 278,400 in the third quarter to 54.1 million and participation rose 0.1 point to 68.5 percent, but youth unemployment rose 0.4 point to 9.07 percent18: more available workers have not meant better matching for new entrants. China's urban surveyed unemployment rate fell to 5.2 percent in September and enterprise employees averaged 48.3 hours a week15, while the manufacturing PMI's employment index fell to 48.4 even as its production index rose to 51.719. A diffusion index below 50 means more purchasing managers reported fewer workers than more; it is not a rate of job loss. Combined with Mexico's falling manufacturing employment (see 04), these three markets do not show a common factory-labor shortage. Shortages may exist in particular skills, shifts or industrial parks, but establishing them requires local order books, vacancy durations and recruitment costs that were not available.
Exhibit 5. Export-hub labor indicators point to divergence, not a common shortage
|
Market |
Indicator |
Latest |
Comparator |
Interpretation limit |
|
China |
Urban surveyed unemployment |
5.2% (Sep) |
5.3% (Aug) |
Not a factory vacancy rate |
|
China |
Manufacturing PMI, employment |
48.4 (Sep) |
48.7 (Aug) |
Diffusion index; not a job-growth rate |
|
China |
Manufacturing PMI, production |
51.7 (Sep) |
50.4 (Aug) |
Diffusion index |
|
China |
Enterprise employee hours |
48.3 per week (Sep) |
No matched comparator |
May reflect sector mix or working practice |
|
China |
Rural migrant workers |
192.70m (end-Q3) |
+0.4% y/y |
A stock, not a net flow |
|
Mexico |
Manufacturing employment (EMIM) |
−1.0% y/y (Aug) |
−0.1% m/m |
Seasonally adjusted changes |
|
Mexico |
Real remuneration (EMIM) |
+2.7% y/y (Aug) |
−0.2% m/m |
Rising pay is not proof of scarcity |
|
Mexico |
IMMEX manufacturing employment |
2,814,352 (Jul) |
−0.7% y/y |
Different universe and month from EMIM |
|
Mexico |
Employment rate, ages 15–64 |
63.2% (Q2) |
63.2% (Q1) |
OECD harmonized definition |
|
Vietnam |
Labor force, ages 15+ |
54.1m (Q3) |
+278,400 q/q |
Not comparable with OECD ages 15–64 |
|
Vietnam |
Youth unemployment |
9.07% (Q3) |
+0.4 pt q/q |
Rose as the labor force grew |
|
Vietnam |
Industry & construction employment |
about 18.0m (Q3) |
+394,100 y/y |
Broader than manufacturing |
Definitions, survey universes and reference periods differ across markets; the table is not a ranking of labor tightness. Sources: National Bureau of Statistics of China15,19; INEGI20,21; OECD17; National Statistics Office of Vietnam18.
In the United States the latest data are older and point to slow hiring rather than scarcity. September payrolls rose 29,000, with July and August revised down by a combined 60,000; unemployment was 4.2 percent and participation 61.8 percent22. In August, manufacturing job openings fell from 576,000 to 522,000 while manufacturing hires rose from 293,000 to 332,00023. Openings are a stock and hires a flow, and fewer openings alongside more hires is what filling positions looks like; falling openings should not be read as either weakening demand or easing scarcity without the hires data beside them. The Beige Book, covering information gathered through October 5, described labor availability as generally adequate, with persistent constraints in specialized, technical and skilled-trade roles24. Next scheduled evidence: U.S. state employment (October 20), September job openings (November 3) and the October employment report (November 6)25.
04. Wages, Labor Costs & Workforce Competitiveness
Workers' pay and employers' labor costs moved in ways that do not line up, and treating either as a competitiveness measure would mislead.
In the United States, private-sector average hourly earnings rose to $37.81 in September from $37.76, a gain that inflation more than erased: real hourly earnings fell 0.5 percent on the month and stood 0.7 percent below a year earlier3. That is the purchasing-power side, examined in the Editorial Analysis. The cost side looks different. Revised second-quarter data show manufacturing unit labor costs falling at a 0.3 percent annualized rate as manufacturing productivity grew 2.4 percent, although unit labor costs were still 3.4 percent above a year earlier26. Unit labor costs, not hourly wages, determine what labor adds to the price of a manufactured good.
Mexico shows why rising pay is not evidence of scarcity. INEGI's August manufacturing survey, released October 16, reported employment down 1.0 percent and hours down 0.6 percent from a year earlier, while real average remuneration rose 2.7 percent, all on a seasonally adjusted basis20. Separate July data for establishments in the IMMEX export program, which employed 2,814,352 people in manufacturing, show the same pattern: manufacturing employment down 0.7 percent on the year and real remuneration up 5.5 percent21. The two surveys cover different establishments and months and are not one series. Higher pay alongside fewer workers and hours can reflect a shift toward higher-paid roles, retention of experienced staff while hiring slows, mandated wage increases or weak demand as easily as competition for scarce labor. Nearshoring cost models that apply a scarcity premium to Mexican labor need establishment-level evidence of unfilled positions and rejected offers before doing so.
Elsewhere, Vietnam's average worker income reached VND 9.2 million a month in the third quarter, 9.9 percent higher in nominal terms than a year earlier, a figure not adjusted for inflation or output18. In the United Kingdom, regular pay in May to July grew 6.3 percent in the public sector against 2.9 percent in the private sector, a gap shaped by the timing of public-sector pay awards27. Boston and Chicago Fed contacts reported pressure from benefit and health-insurance costs, and Boston contacts said such costs were constraining hiring16,28. Chicago contacts also reported more applicants after nearby layoffs, which suggests that for some employers nonwage costs can bind even where applicants are easier to find.
No matched cross-country panel of compensation, output and exchange rates was built, so The Meridian offers no international labor-cost ranking. Next: the U.S. Employment Cost Index for the third quarter (October 30) and third-quarter productivity and costs (November 5)25. The UK's October labor release, due October 20, falls after this edition's research cutoff.
05. Skills, Education & Workforce Development
Status: Funding and program facts verified; labor-supply effect not established.
The week's skills news concerns money committed, and the evidence on what that money buys is thin. The U.S. Department of Labor announced on October 16 the seventh round of its Workforce Opportunity for Rural Communities grants: $81,542,854 across 13 projects in 11 states, for industry-driven training in skilled trades, construction, manufacturing, energy, health care and information technology29. The average award is about $6.3 million. The program's own table already listed all 13 awards as active on October 1, so the announcement date is not the start of training30. Neither source reports enrollment, completions, credentials, placements or retention, so no estimate of added workers or cost per placement is possible.
The ILO's October 16 account of a green construction-skills pilot in the Philippines describes four training modules and participants' experiences but gives no cohort size, completion rate, recognized credentials or employer placements31. It is a training pathway worth tracking, not evidence of new capacity for construction or industrial projects.
Vietnam offers a measurable test of the assumption that more credentials relieve labor shortages. The share of workers holding a degree or training certificate rose to 30.4 percent in the third quarter, up 0.6 point on the quarter and 1.1 points on the year, yet youth unemployment rose and about 1.6 million young people were neither employed nor in education or training18. Credentials and job matching are moving separately. The European Commission's annual employment and social report, summarized on October 13, supplies a competing explanation for some shortages: hard-to-fill occupations often carry low pay, atypical hours or insecure contracts32. Where that is the cause, more training will not fill the vacancy.
The operating question for employers and project developers is conversion: how many entrants become qualified, retained workers in the roles and locations where vacancies exist. Funding announcements answer none of that, and the first grantee outcome reports have no confirmed date.
06. Labor Productivity, Automation & Workforce Transformation
The strongest new evidence this week concerns how productivity is measured rather than how fast it is growing. The UK Office for National Statistics said on October 14 that linking tax-payroll records with its labor survey indicates a stronger post-pandemic employment recovery and a smaller rise in economic inactivity than the survey alone showed, and that a revised productivity decomposition gives a larger role to falling hours33. The revised headline methods are due in November; revised levels have not been published. Anyone benchmarking UK labor productivity, or comparing UK and U.S. productivity trends, should expect the history to change.
In the United States, revised second-quarter data show nonfarm productivity growing at a 1.4 percent annualized rate and manufacturing productivity at 2.4 percent, revised up from 1.9 percent because manufacturing output growth was revised from 4.6 percent to 5.4 percent26. The upward revision was driven by the larger revision to output growth. These are historical figures and say nothing about AI's effect in October.
On automation and AI, the Beige Book provides leads rather than measurements. Contacts in five of the twelve Federal Reserve districts reported AI-related attrition, delayed hiring or expectations of slower job creation24. Five districts is a count of regions where such reports appeared, not a share of firms or jobs. The district reports also record the opposite effect. A Dallas staffing firm was adding recruiters to review AI-generated interviews, while another Dallas contact described entry-level accounting contracts delayed partly because of AI34. Boston reported stronger hiring in law, accounting and insurance and weaker hiring in health IT16. The ILO's May review of empirical studies found heterogeneous effects on tasks and limited robust evidence of broad displacement, though some of its evidence, including Danish data, runs only through 2024 and cannot rule out more recent change35.
The Meridian's reading is that AI is reorganizing specific tasks and entry-level hiring in some occupations and creating supervisory and validation work in others, and that nothing in this research measures a national employment effect. Firms building AI business cases should count the review, supervision, training and error-correction time that adoption adds, and track hiring by task and seniority, because a smaller entry-level intake now becomes a shortage of experienced staff later. Next: U.S. third-quarter productivity and costs (November 5) and the ONS November methods implementation25,33.
07. Household Income, Wealth & Purchasing Power
U.S. real employee earnings fell 0.5 percent in September (see Editorial Analysis). The broader income measure is a month behind: real disposable personal income was unchanged in August after a 0.3 percent rise in July, and the saving rate was 4.1 percent6. September's figures arrive October 29, and they are the subject of this edition's Call to Audit.
China's per-capita disposable income for January to September was CNY 34,230, up 5.3 percent in nominal terms and 4.4 percent after inflation15. Rural incomes grew faster in real terms (5.6 percent) than urban incomes (3.6 percent), and the urban-to-rural ratio narrowed by 0.04 to 2.39. Property income grew only 1.6 percent in nominal terms against 5.3 percent for wage income, consistent with weak returns on housing and financial assets. Exporters selling into China should weigh the composition as well as the total: incomes are growing faster in rural households, which start from a much lower base (CNY 18,809 against CNY 44,945 for urban residents), and property income is lagging well behind wages, which limits any wealth effect for asset-holding urban consumers. Whether that shifts demand away from imported discretionary goods is an inference; the research did not measure import propensities by household type.
The Federal Reserve's Survey of Consumer Finances, released October 9, shows the distribution behind U.S. averages36. Median family income rose from $76,900 in 2021 to $82,200 in 2024, and median net worth from $211,100 in 2022 to $215,900 in 2025, all in 2025 dollars. But among families with transaction accounts the median balance fell from $8,800 to $8,200, median net worth for families headed by someone under 35 fell from $42,700 to $33,000, and the share of families whose debt payments exceeded 40 percent of income rose from 6.5 percent to 8.6 percent. These are snapshots of different families at different dates, and none describes October 2026. They do show that liquid buffers and the finances of younger households were thinning even as aggregate wealth rose. Those are the households with the least room to absorb higher fuel costs, though the survey cannot show how they responded in September.
08. Consumer Spending, Retail Demand & Consumption Patterns
The Editorial Analysis covers September's U.S. retail composition in detail. Three further developments bear on consumption patterns.
NRF forecast on October 15 that November–December holiday sales will grow 4.2 percent to $1.013 trillion, excluding automobile dealers, gasoline stations and restaurants, with 325,000 to 375,000 seasonal hires against an estimated 356,000 last year8. This is a trade association's projection, not realized demand. On September's Census data, The Meridian's approximation of the same grouping was 4.6 percent above a year earlier, so the forecast implies somewhat slower nominal growth than the current pace (an indicative comparison of one month with a two-month season), and the hiring range is centered close to last year's level. Chicago Fed contacts expected seasonal hiring at or below last year's28.
China's consumption is growing mainly through services. Retail sales of goods and services rose 2.6 percent in January to September, with services up 5.0 percent and goods up 1.0 percent; September retail sales of consumer goods rose 1.1 percent from a year earlier, up from 0.4 percent in August15. These measures have different scopes and should not be added together. Services-led growth generally carries less direct demand for imported merchandise than goods-led growth of the same size, but the import content of Chinese consumption was not measured.
The disagreement between Census and the NRF card monitor on furniture, 4.9 percent growth against a 2.7 percent decline over the year, remains unresolved and is discussed in the Editorial Analysis1,4. What is missing across all of these is the link from spending to merchandise flows: no matched import quantities, retailer inventory data or purchase-order data were available. BEA's real spending by category (October 29) and October retail sales (November 17) are the next tests.
09. Consumer Credit, Savings & Demand Sustainability
Status: Verified at single-lender scope; no representative current borrower data.
This week's credit evidence argues for tracking early warning signs and realized losses separately rather than declaring either stress or health. JPMorgan's third-quarter disclosure on October 13 shows its card business's 30-day-plus delinquency rate at 1.97 percent, up from 1.91 percent in the second quarter but down from 2.14 percent a year earlier, and its net charge-off rate at 2.91 percent, down from 3.34 percent in the second quarter and 3.15 percent a year earlier7. Card sales volume excluding commercial cards was $376.0 billion, 9.2 percent above a year earlier, and average card loans rose 6.7 percent to $250.1 billion. Early delinquencies can lead losses, but quarterly movements also reflect seasonality, the aging of new accounts and portfolio mix, and one lender is not the market.
Exhibit 6. One large card portfolio: early delinquency up on the quarter, losses down
|
JPMorgan Card Services |
Q3 2025 |
Q2 2026 |
Q3 2026 |
Change on quarter |
Change on year |
|
30+ day delinquency rate (%) |
2.14 |
1.91 |
1.97 |
+0.06 pt |
−0.17 pt |
|
Net charge-off rate (%) |
3.15 |
3.34 |
2.91 |
−0.43 pt |
−0.24 pt |
|
Card sales volume, excl. commercial (US$ bn) |
344.4 |
373.1 |
376.0 |
+0.8% |
+9.2% |
|
Average card loans (US$ bn) |
234.4 |
243.5 |
250.1 |
+2.7% |
+6.7% |
As reported by the issuer; changes are Meridian calculations. One lender's portfolio is not a representative measure of U.S. household credit, and the supplement does not label whether the charge-off rate is annualized. Source: JPMorgan Chase & Co.7.
The national data available are older and mixed in the same way. Revolving consumer credit fell $4.8 billion in August, a 4.2 percent annualized decline, while nonrevolving credit, which includes auto and student loans, rose at a 4.1 percent rate5. The New York Fed's September consumer survey found the average perceived probability of missing a debt payment in the next three months fell 1.0 point to 12.2 percent, even as respondents' assessments of their financial situation worsened37. The Survey of Consumer Finances records a rise in the share of families with debt payments above 40 percent of income, from 6.5 percent in 2022 to 8.6 percent in 202536, a historical increase in debt burden that current loss rates do not yet reflect. In the euro area, the household saving rate fell to 14.2 percent in the second quarter from a revised 14.4 percent38; that rate is defined differently from the U.S. personal saving rate (4.1 percent in August) and the two should not be compared directly.
The signal that would change the picture for lenders, card partners and retailers that depend on financed purchases is not one quarter's delinquency uptick at one issuer. It is a rise in early delinquencies across several comparable lenders that then rolls into later delinquency and losses while credit availability tightens. That pattern is not present in the evidence.
10. Cross-Layer Demographics, Labor & Consumption Implications
The strongest cross-layer connections this week run through energy prices, import prices and freight, and several commonly asserted links failed the evidence test.
Energy prices and the retail signal (Energy; Macroeconomics & Monetary Policy)
September's energy price increases coincided with two developments in this layer. Real earnings fell as consumer prices rose 0.6 percent, and gasoline-station receipts supplied most of the nominal retail gain. The second makes the most widely followed demand indicator least informative precisely when purchasing power is under pressure. How much of the receipts increase reflects price rather than volume, and how much discretionary spending was displaced, is not measured; substitution, transfers, savings and higher-income households can absorb part of the pressure1,3,2.
Import prices and importer costs (Trade Policy & Geopolitics; Supply Chain Resilience & Infrastructure)
Nonfuel import prices rose 6.0 percent over the year to September, and imported consumer goods excluding autos 2.7 percent9. Whether the increase reflects tariffs, currency, input costs or supplier pricing was not established; the release passages reviewed did not identify tariff treatment. The commercial effect runs through contracts and inventory. Importers holding stock bought at older costs can defer the increase, while those replenishing now pay the higher prices and must choose between margin and shelf price. That choice, not yet observed, decides how much of the import-price increase reaches household purchasing power in the first quarter.
Freight rates are not a demand gauge right now (Freight Rates & Trends)
Chicago Fed contacts reported flat trucking demand alongside higher rates driven by capacity and diesel costs28. When fuel and capacity set rates, rising freight prices can coexist with flat consumer volume, so neither freight rates nor retail receipts should be used to confirm the other. The chain from household demand through retailer orders and import volumes to lane volumes and rates was not verified, and The Meridian makes no freight-rate call from this layer.
Labor and industrial execution (Manufacturing & Industrial Development; Supply Chain Resilience & Infrastructure)
Mexico's falling manufacturing employment alongside rising real pay, and China's weaker employment index alongside stronger production, matter for site selection and supplier ramp-up, but they are as consistent with weak orders or productivity gains as with labor scarcity15,19,20. Dallas contacts described skilled-trade constraints in manufacturing and construction34. Where projects slip, power, permitting, finance or equipment may be the binding constraint rather than labor; staffing-attributable delay was not measured anywhere in the research.
Task reorganization (Technology, AI & Digital Trade)
Reports of AI-related attrition and delayed hiring in five districts24 sit alongside a Dallas staffing firm adding recruiters to review AI-generated interviews34. The connection to this layer is a change in the composition of hiring, particularly at entry level, with consequences for training pipelines and future supplies of experienced staff. Macro-level displacement is unverified.
Consumer credit and supplier cash flow (Capital Markets & Trade Finance)
Mixed consumer credit signals could affect financed purchases and, through retailers' payment behavior, suppliers' working capital. The household inputs are verified. Effects on supplier finance, payment terms and credit spreads are not.
Links examined and not retained
Three proposed connections did not meet the evidence standard. Green-construction training as a response to new environmental qualification rules (Climate, Resources & Environmental Regulation): no binding requirement or project effect was found. Retail demand translated into chemical or polymer demand (Chemicals): no matched orders or offtake data exist, and retail sales should not be converted into resin estimates. Construction labor interacting with metal and component lead times (Commodities): Chicago contacts reported lead-time pressure, but no material-specific shortage or price effect is established28.
The Meridian Outlook
The Meridian's forecast ledger holds no published position for Demographics, Labor & Consumption, so there is no earlier view to reconcile; the assessments below open the record for this layer.
Base case: a season of noisy demand signals
Through the end of the holiday season, nominal U.S. retail receipts are likely to keep overstating the breadth of real merchandise demand in any month when energy prices are still rising, and year-over-year comparisons will stay inflated by gasoline-station receipts for as long as fuel prices remain above year-earlier levels. The Meridian expects real disposable income to show no gain for September (the Call to Audit below sets the precise test), real goods spending outside energy to be uneven across categories rather than collapsing, and holiday results to land in a range that both the "resilient consumer" and "squeezed consumer" narratives can claim. For importers, that means conflicting signals through December, in which order discipline and contract flexibility are worth more than a directional bet. The pattern is the one documented in September: rising energy prices coincided with gasoline-station receipts dominating nominal growth and with falling real earnings, while higher import prices can raise the value of merchandise flows without adding units.
Alternative case: fast energy relief
If gasoline prices retreat sharply through October and November, real earnings recover, discretionary categories gain room and holiday demand broadens. Nominal retail receipts would slow mechanically as gasoline-station sales fall, so in this case the headline would understate the improvement, the inverse of September's distortion. Buyers who rebuilt their demand signal from units would read this correctly; those watching the headline would be inclined to cut just as demand firms.
Downside case: the squeeze reaches credit
Energy and import prices stay high, early delinquencies rise across several lenders and roll into losses, and retailers cut replenishment after a soft start to the season. The signs would be falling real goods spending outside energy, rising inventory-to-sales ratios at retailers and multi-lender delinquency transitions. None of these is present in current evidence.
Exposures
Importers that committed early-2027 volumes on the strength of nominal receipts face excess inventory carried at higher unit costs if the downside case develops. Importers that kept commitments staged against sell-through can capture demand late if the alternative case develops. Retailers absorbing import-price increases to protect volume face margin pressure in the first quarter; those passing them through risk further eroding unit demand among households with thin liquid buffers. In labor markets, site-selection teams that build a general scarcity premium into Mexican or Chinese labor costs risk mispricing, while those assuming abundant labor can miss skill-specific gaps in technicians, electricians and particular shifts.
Forecast conditions and invalidators
The base case assumes energy prices remain elevated through October, no large one-off transfer payments lift household income, and holiday promotional intensity is typical. It would be invalidated by broad real goods spending growth outside energy in BEA's September data, by October retail growth outside gasoline spread across furniture, electronics, clothing, general merchandise and non-store retailers, or by retailers reporting lean inventories and rising orders.
Labor markets over the next two quarters
The Meridian's qualitative judgment is that export-hub labor constraints will remain local and skill-specific rather than general. Mexico's combination of falling manufacturing employment and rising real pay is more likely to persist as compositional change than to become broad scarcity unless orders recover. On AI, the more likely pattern is continued reports of slower routine and entry-level hiring alongside complementary hiring, without a measurable national employment effect in official data over that horizon. These are directional views, not scored forecasts.
Confidence
Confidence is high that nominal receipts were a poor proxy for demand breadth in September, because that is an accounting result from published tables. It is moderate on the near-term weakness of real household income, because nonlabor income can offset falling real wages. It is low on the direction of unit demand in specific import categories, because no matched quantity, inventory or order data were available.
Decision implications
For procurement and inventory planning, the practical rule is to separate price from volume in every category plan, tie incremental holiday and early-2027 commitments to confirmed sell-through and purchase orders, and preserve flexibility through mid-November. For workforce planning, test staffing feasibility locally before assuming a market-wide shortage or surplus, and treat participation and retention of older workers as a real lever. For credit-dependent sales, watch transitions from early to late delinquency across lenders rather than any one issuer's quarter.
Calls to Audit
|
DLC Call 1: U.S. real disposable personal income, September 2026 |
|
|
Proposition |
The
Bureau of Economic Analysis's first published estimate of U.S. real
disposable personal income for September 2026 will show a month-over-month
change of 0.0 percent or lower. |
|
Measured variable |
Real
disposable personal income (chained dollars, seasonally adjusted at annual
rates), percent change from August 2026 to September 2026. |
|
Governing source |
BEA,
Personal Income and Outlays, September 2026, first release (scheduled October
29, 2026). Later revisions do not affect evaluation. |
|
Baseline |
August
2026: 0.0 percent (July 2026: +0.3 percent), per BEA's Personal Income and
Outlays, August 2026. |
|
Threshold and rule |
Change
of 0.0 percent or lower, inclusive. The controlling figure is the percent
change from the preceding month for real disposable personal income shown to
one decimal place in the release's percent-change table, which takes
precedence over narrative wording; a displayed −0.0 counts as 0.0. If no such
figure is shown, the change is computed from the release's chained-dollar
levels for August and September 2026 and rounded to one decimal place. |
|
Observation period and cutoff |
Reference
month September 2026; the first BEA release containing September 2026 data,
including any combined multi-month release, published on or before December
31, 2026 governs. |
|
Evaluation date |
The
date of that first release (scheduled October 29, 2026). |
|
Early resolution |
None. |
|
INDETERMINATE if |
No
September 2026 Personal Income and Outlays release is published by December
31, 2026, or the release reports neither the percent change nor the
chained-dollar levels needed to compute it. |
|
Geography and definitions |
United
States; BEA national accounts definitions; seasonally adjusted. |
|
Confidence |
Moderate. Real employee earnings fell 0.5
percent and the CPI energy index rose 5.2 percent in September, but
transfers, investment income and changes in employment can offset falling
real wages. A rise of 0.1 percent or more makes the call incorrect. |
Signals to Watch
1. BEA September income and spending (October 29). Tests whether the purchasing-power squeeze and the gap between receipts and real demand appear in the broader national accounts. Real disposable income at or below zero supports the base case and settles the Call to Audit. The more discriminating figure is real goods spending outside gasoline and other energy goods: broad growth there would contradict the editorial thesis and justify relaxing order caution, while flat or falling figures would reinforce it. Source: BEA Personal Income and Outlays.
2. October retail sales composition (November 17). Tests whether September's concentration persists. Watch gasoline stations' share of the monthly change, growth outside gasoline, and the grouping excluding vehicle dealers, gasoline stations and restaurants. Growth outside gasoline spread across furniture, electronics, clothing, general merchandise and non-store retailers would ease the breadth concern; another month in which gasoline supplies most of the change would extend it. Source: Census Bureau advance monthly retail report.
3. Retailer inventories, orders and seasonal hiring (November–December). Tests whether demand uncertainty is reaching replenishment. Rising inventory-to-sales ratios and reduced orders in retailer disclosures would support the downside case; lean inventories with rising orders would contradict it. Seasonal retail hiring well below NRF's 325,000-to-375,000 range would signal retailers expecting weaker volume. Sources: retailer third-quarter filings and calls, BLS employment reports (November 6 and December).
4. Early versus realized consumer credit losses (fourth-quarter issuer results, dates not yet announced). Tests the downside case. Baseline: JPMorgan Card Services 30-day-plus delinquency 1.97 percent and net charge-offs 2.91 percent in the third quarter. A rise in early delinquencies across several comparable lenders that rolls into later delinquency and losses would signal financed demand under strain; a single issuer's seasonal uptick would not. Sources: issuer earnings supplements, Federal Reserve G.19.
5. Mexico manufacturing employment and real pay (IMMEX October 26; EMIM November 17). Tests the view that rising Mexican pay reflects composition and weak demand rather than scarcity. Baseline: August manufacturing employment down 1.0 percent and real remuneration up 2.7 percent over the year. Employment and hours stabilizing alongside accelerating pay and firmer orders would point toward emerging scarcity and justify revisiting nearshoring cost assumptions; continued declines would support the current reading. Source: INEGI.
6. U.S. manufacturing openings versus hires (September job openings, November 3). Tests whether the U.S. labor market is easing through filled positions or weaker demand. Baseline: August manufacturing openings 522,000, hires 332,000. Openings falling with hires also falling would point to weaker demand; openings falling with hires holding would indicate positions being filled. Source: BLS Job Openings and Labor Turnover Survey.
7. Workforce program conversion (first grantee and program reports, dates unconfirmed). Tests whether training funding and migration programs add usable workers. The evidence that matters is entrants, completions, recognized credentials, placements and 90-day retention, with denominators, for the WORC round-seven grantees and the ASEAN partnership's recognition decisions. Funding updates and launch events would not change the assessment. Sources: U.S. Department of Labor, ILO.
Sources
Figures from the Census Bureau, BLS (real earnings, CPI and import prices), BEA, the Federal Reserve G.19, the National Bureau of Statistics of China, NRF and JPMorgan Chase were checked against the original releases on October 19, 2026. Meridian calculations are identified as such in the text and exhibits. Sources are numbered in order of first citation.
1. U.S. Census Bureau. Advance Monthly Sales for Retail and Food Services, September 2026 (CB26-165). October 15, 2026. https://www.census.gov/retail/marts/www/marts_current.pdf Current-release locator; figures as published October 15, 2026.
2. U.S. Bureau of Labor Statistics. Consumer Price Index, September 2026. October 14, 2026. https://www.bls.gov/news.release/archives/cpi_10142026.htm
3. U.S. Bureau of Labor Statistics. Real Earnings, September 2026 (USDL-26-1575). October 14, 2026. https://www.bls.gov/news.release/archives/realer_10142026.htm
4. National Retail Federation. CNBC/NRF Retail Monitor Shows 12th Month of Sales Growth in September. October 8, 2026. https://nrf.com/media-center/press-releases/cnbc-nrf-retail-monitor-shows-12th-month-of-sales-growth-in-september
5. Board of Governors of the Federal Reserve System. Consumer Credit, G.19 (August 2026 data). October 7, 2026. https://www.federalreserve.gov/releases/g19/20261007/
6. U.S. Bureau of Economic Analysis. Personal Income and Outlays, August 2026 (BEA 26-43). September 30, 2026. https://www.bea.gov/news/2026/personal-income-and-outlays-august-2026
7. JPMorgan Chase & Co.. 3Q26 Earnings Supplement (Consumer & Community Banking, Card Services). October 13, 2026. https://www.jpmorganchase.com/content/dam/jpmc/jpmorgan-chase-and-co/investor-relations/documents/quarterly-earnings/2026/3rd-quarter/c89c7479-82df-4c9f-a7be-957956430abd.pdf
8. National Retail Federation. NRF Forecasts 2026 Holiday Sales Growth as Consumers Remain Resilient. October 15, 2026. https://nrf.com/media-center/press-releases/nrf-forecasts-2026-holiday-sales-growth-as-consumers-remain-resilient
9. U.S. Bureau of Labor Statistics. U.S. Import and Export Price Indexes, September 2026. October 16, 2026. https://www.bls.gov/news.release/archives/ximpim_10162026.htm
10. Eurostat. Almost 60% of Europeans were of working age in 2025. October 6, 2026. https://ec.europa.eu/eurostat/web/products-eurostat-news/w/ddn-20261006-1
11. Statistics Bureau of Japan. 人口推計 2026年(令和8年)9月報 [Population Estimates, September 2026]. September 24, 2026. https://www.stat.go.jp/data/jinsui/pdf/202609.pdf
12. Statistics Bureau of Japan. Population Estimates: Release Schedule of Monthly Report. Schedule updated January 20, 2026. https://www.stat.go.jp/english/data/jinsui/3.html
13. International Labour Organization. ILO, Australia and Switzerland launch partnership for fair and effective labour migration in ASEAN. October 14, 2026. https://www.ilo.org/resource/news/ilo-australia-and-switzerland-launch-partnership-fair-and-effective-labour-0
14. Swiss Agency for Development and Cooperation. TRIANGLE Partnerships (for fair and effective labour migration in ASEAN), Phase 1. Project record; last-update date uncertain. https://www.eda.admin.ch/deza/en/home/projekte/projekte.html/content/dezaprojects/SDC/en/2026/7F11579/phase1
15. National Bureau of Statistics of China. National Economy was Generally Stable with New Achievement Made in High-Quality Development in the First Three Quarters. October 19, 2026. https://www.stats.gov.cn/english/PressRelease/202610/t20261019_1965619.html
16. Federal Reserve Bank of Boston. Beige Book, October 2026: First District, Boston. October 14, 2026. https://www.federalreserve.gov/monetarypolicy/beigebook202610-boston.htm
17. OECD. Labour Market Situation, Q2 2026. October 15, 2026. https://www.oecd.org/content/dam/oecd/en/data/insights/statistical-releases/2026/10/labour-market-situation-oecd-10-2026.pdf
18. National Statistics Office of Vietnam. Thông cáo báo chí về tình hình lao động, việc làm quý III và 9 tháng năm 2026 [Press release on labor and employment, Q3 and nine months of 2026]. October 3, 2026. https://www.nso.gov.vn/tin-tuc-thong-ke/2026/10/thong-cao-bao-chi-ve-tinh-hinh-lao-dong-viec-lam-quy-iii-va-9-thang-nam-2026/
19. National Bureau of Statistics of China. Purchasing Managers' Index for September 2026. October 1, 2026. https://www.stats.gov.cn/english/PressRelease/202610/t20261008_1965466.html
20. INEGI (Mexico). Encuesta Mensual de la Industria Manufacturera (EMIM), agosto de 2026. October 16, 2026. https://www.inegi.org.mx/contenidos/saladeprensa/boletines/2026/emim/emim2026_10.pdf
21. INEGI (Mexico). Indicadores de establecimientos con programa IMMEX, julio de 2026. September 23, 2026. https://www.inegi.org.mx/contenidos/saladeprensa/boletines/2026/immex/immex2026_09.pdf?ref=chidonomics.com
22. U.S. Bureau of Labor Statistics. The Employment Situation, September 2026. October 2, 2026. https://www.bls.gov/news.release/archives/empsit_10022026.htm
23. U.S. Bureau of Labor Statistics. Job Openings and Labor Turnover, August 2026 (USDL-26-1547). September 29, 2026. https://www.bls.gov/news.release/archives/jolts_09292026.htm
24. Federal Reserve System. Beige Book, October 2026: National Summary. October 14, 2026. https://www.federalreserve.gov/monetarypolicy/beigebook202610-summary.htm
25. U.S. Bureau of Labor Statistics. Schedule of Selected Releases 2026. Consulted October 19, 2026. https://www.bls.gov/schedule/2026/home.htm
26. U.S. Bureau of Labor Statistics. Productivity and Costs, Second Quarter 2026, Revised. September 3, 2026. https://www.bls.gov/news.release/archives/prod2_09032026.htm
27. Office for National Statistics. Labour market overview, UK: September 2026. September 15, 2026. https://www.ons.gov.uk/employmentandlabourmarket/peopleinwork/employmentandemployeetypes/bulletins/uklabourmarket/latest Rolling 'latest' locator; figures as published September 15, 2026.
28. Federal Reserve Bank of Chicago. Beige Book, October 2026: Seventh District, Chicago. October 14, 2026. https://www.federalreserve.gov/monetarypolicy/beigebook202610-chicago.htm
29. U.S. Department of Labor, Employment and Training Administration. US Department of Labor awards $81.5M in grants to support industry-driven job training programs in rural communities (26-1441-NAT). October 16, 2026. https://www.dol.gov/newsroom/releases/eta/eta20261016
30. U.S. Department of Labor, Employment and Training Administration. Workforce Opportunity for Rural Communities (WORC) Initiative. Program page; award table as of October 1, 2026. https://www.dol.gov/agencies/eta/demonstration-grants/workforce-opportunity
31. International Labour Organization. Green skills support construction workers in the Philippines. October 16, 2026. https://www.ilo.org/resource/article/green-skills-support-construction-workers-philippines
32. European Commission, DG Employment, Social Affairs and Inclusion. Job quality is a priority in the EU, according to annual Commission report. October 13, 2026. https://employment-social-affairs.ec.europa.eu/news/job-quality-priority-eu-according-annual-commission-report-2026-10-13_en
33. Office for National Statistics (James Benford). Improved surveys and statistics delivering new insights on the UK economy. October 14, 2026. https://blog.ons.gov.uk/2026/10/14/improved-surveys-and-statistics-delivering-new-insights-on-the-uk-economy/
34. Federal Reserve Bank of Dallas. Beige Book, October 2026: Eleventh District, Dallas. October 14, 2026. https://www.federalreserve.gov/monetarypolicy/beigebook202610-dallas.htm
35. International Labour Organization (Merola, Ernst, Samaan, del Rio-Chanona and Teutloff). The impact of GenAI on jobs, productivity and work organization: a review of the empirical evidence. May 2026. https://www.ilo.org/sites/default/files/2026-06/Research%20Brief_The%20impact%20of%20GenAi%20on%20jobs%20and%20work%20organization%20a%20review%20of%20empirical%20evidence.pdf
36. Board of Governors of the Federal Reserve System. Changes in U.S. Family Finances from 2022 to 2025: Evidence from the Survey of Consumer Finances. October 2026 (released October 9, 2026). https://www.federalreserve.gov/publications/files/scf26.pdf
37. Federal Reserve Bank of New York, Center for Microeconomic Data. Short- and Medium-Term Inflation Expectations Increase; Labor Market Expectations Improve (Survey of Consumer Expectations, September 2026). October 7, 2026. https://www.newyorkfed.org/newsevents/news/research/2026/20261007
38. Eurostat. Household saving rate decreases to 14.2% in the euro area. October 2, 2026. https://ec.europa.eu/eurostat/web/products-euro-indicators/w/2-02102026-bp