
A New Structure for The Meridian
Most trade coverage tells you what happened. That is a commodity now, available free and instantly from a hundred feeds. What it rarely tells you is what to think, why it matters, and what moves next. That gap is the entire reason The Meridian exists, and our new structure adds even more depth.

Editorial: An Argument Is Worth More Than a Summary
There was a time when knowing what happened was the hard part. A shipment was delayed, a price moved, a policy changed, and the value was in simply having that information before the next person did. That time is over. Every price print, every regulatory filing, every rate index is now available the moment it exists, pushed to more screens than anyone can read. The scarce thing is no longer the fact. The scarce thing is the judgment that turns a pile of facts into a decision.
That conviction is why The Meridian now leads every article with an editorial rather than a recap. An editorial is a promise to the reader that someone sat with the week's developments, decided what actually mattered, and is willing to argue for a position and be judged on it. When crude fell five percent on a ceasefire announcement this spring, the recap was that oil dropped on peace optimism. The argument, the one worth paying for, was that the paper market had repriced faster than a mined strait could physically reopen, and that the gap between the two was the whole trade for the quarter ahead. Anyone can report the price. The value is in the sentence that tells you what the price is missing.
An argument carries an obligation that a summary does not. It has to be defensible. It has to have a thesis, evidence, and a conclusion that earns its final paragraph rather than trailing off into hedged neutrality. It has to be willing to be wrong in public, which is the only way analysis ever becomes trustworthy. Neutrality that refuses to commit is not objectivity. It is an abdication, and it leaves the reader exactly where they started, holding facts with no idea what to do with them.
None of this means opinion floating free of evidence. The opposite. An argument is only as good as the reporting underneath it, which is precisely why the editorial is the beginning of each article and never the end. After the position comes the proof: the full, sourced, comprehensive landscape of the vertical, laid out so the reader can check the argument against the facts and disagree if the facts point elsewhere. The editorial earns attention. The updates that follow earn trust.
We would rather be usefully opinionated and occasionally wrong than reliably neutral and permanently useless. That is the trade every issue now makes on purpose.
The Four Commitments
Every article now rests on four structural commitments. They are fixed, they appear in the same order every time, and together they define what it means for a piece to belong in this publication. Understanding them is the fastest way to get value from everything that follows.
One: The Editorial Lead
Each article opens with an editorial that states a clear position on the single most important development in that vertical this week. Not a list of everything that happened. A judgment about what mattered most, why, and what it implies for the reader who has to make a decision. The editorial is where the analysis lives, where the publication takes a stance it can be held to, and where the reader learns not just the news but the argument about the news. It is deliberately the first thing on the page because it is the most valuable thing on the page.
Two: The Fixed Updates
After the argument comes the evidence, and the evidence is comprehensive by design. Where trade coverage often chases a single dramatic thread and ignores the rest of the market, The Meridian commits to covering the full landscape of each vertical in every issue. An energy article is not a crude oil article. It covers crude, natural gas and LNG, refinery margins, US production, electricity and renewables, and energy policy, because a reader who buys natural gas or plans grid capacity deserves the same depth as a reader who trades crude. A chemicals article covers feedstock economics, polymers, specialty chemicals, agricultural chemicals, and regulation. The fixed updates are the promise that the reader will not have to go anywhere else to understand the whole picture.
These updates are structured, sourced, and consistent from week to week, so a reader can find the section they care about immediately and track it over time. The consistency is the point. When the same categories appear in the same order every issue, the reader builds a mental model of the market that compounds week over week rather than resetting each time.
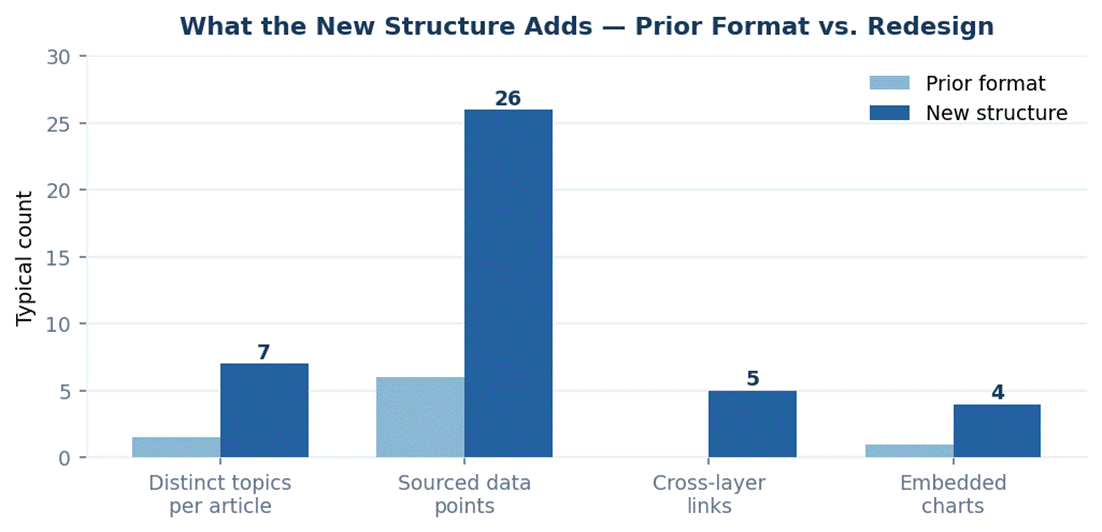
What the New Structure Adds — Prior Format vs. Redesign | Source: The Meridian editorial framework
Three: The Graphs
Numbers belong in pictures. Every issue that has data worth charting now carries graphs, and they arrive in two forms. Inside the document, charts are embedded directly alongside the analysis they support. Separately, a companion visual file renders the same charts as clean, interactive graphics built for the web and for sharing. Both use a single consistent visual language so that a reader recognizes a The Meridian chart on sight. A price move described in a sentence is information. The same move shown against its own history is understanding.
Four: Effect on the Framework
Each article closes with the analysis that ties the whole publication together: a section tracing how the week's developments in one layer cascade into the others. This is the feature that makes the publication more than a collection of separate market reports. A shock in trade policy or geopolitics is never only a policy story. It moves energy through supply and price, chemicals through feedstock costs, commodities through fertilizer and fuel, manufacturing through input costs and demand, and freight through the cost of moving everything. The closing section follows those threads explicitly, so the reader finishes each article understanding not just one market but its place in the system.
The Global Trade Framework
The organizing idea behind the entire publication is the Global Trade Framework, a six layer model of how disruption moves through the global economy. The framework holds that shocks tend to cascade downstream in a predictable sequence, from the most upstream inputs to the most downstream services, and that understanding the sequence lets a reader anticipate the next move rather than merely react to the last one.
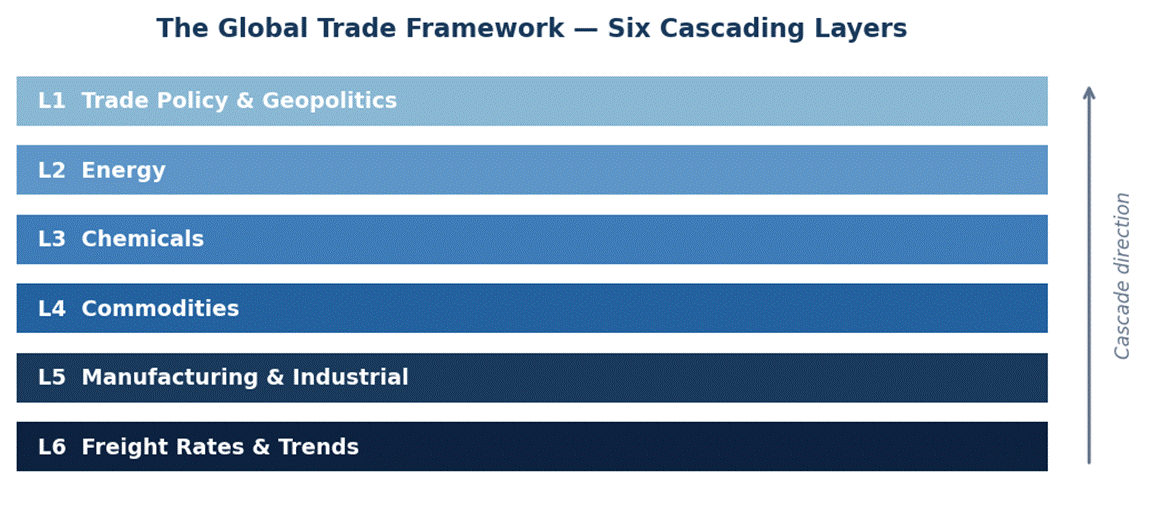
The Global Trade Framework — Six Cascading Layers | Source: The Meridian
The layers run from trade policy and geopolitics at the head to freight rates and trends at the base. Trade policy and geopolitics sits at Level 1 because it is the most upstream force in the modern economy: a tariff, a sanctions regime, a war, or a treaty can move every market beneath it, and the events of 2026 made that primacy impossible to ignore. Energy occupies Level 2, the first market that a geopolitical shock typically moves, and the input that nearly everything else consumes. Chemicals at Level 3 convert energy and hydrocarbons into the materials that industry depends on. Commodities at Level 4 cover the grains, metals, and raw materials whose costs are shaped by policy, energy, and chemical inputs together. Manufacturing and industrial development at Level 5 is where those inputs become finished goods and productive capacity. Freight rates and trends at Level 6 are the most downstream layer, where the cost of every disruption above ultimately shows up as the price of moving what the system produces.
|
GTF Level |
Coverage Area |
Publishing
Day |
Layer |
|
Level 1 |
Trade Policy
& Geopolitics |
Monday |
|
|
Level 2 |
Energy |
Tuesday |
|
|
Level 3 |
Chemicals |
Tuesday |
|
|
Level 4 |
Commodities |
Wednesday |
|
|
Level 5 |
Manufacturing
& Industrial Development |
Thursday |
|
|
Level 6 |
Freight Rates
& Trends |
Friday |
|
Why Trade Policy and Geopolitics Leads the Framework
Level 1, trade policy and geopolitics, is positioned at the head of the framework deliberately. For most of the modern era, energy was treated as the base of any cascade analysis, the input from which everything else flowed. The last several years have made a stronger case that the true origin sits one level higher. A tariff decision, a sanctions package, an export control, or an outright conflict does not wait downstream for another market to move it. It originates the shock, and every layer beneath it, energy, chemicals, commodities, manufacturing, and freight, absorbs the consequences in turn. The 2026 Strait of Hormuz crisis was the clearest possible illustration: the geopolitical event came first, and energy, the layer long treated as the starting point, was actually the first thing the shock moved rather than the source of it.
This does not mean trade policy only pushes in one direction. It remains uniquely reflexive: energy prices, commodity shortages, and freight disruptions all feed back into the political decisions that policymakers make, so the head of the cascade also listens to its own downstream. But the sequencing matters for anticipation, and placing trade policy and geopolitics at Level 1 reflects what the evidence of recent years keeps showing, that the decisions made in capitals and the conflicts fought over trade routes are where the largest cascades begin.
The Cascade Runs on Different Clocks
The most important and least intuitive property of the framework is that the layers do not reprice at the same speed. A shock at Level 1 shows up almost instantly in the paper markets that trade energy just below it, but it can take weeks to reach chemicals and commodities, and months to fully work through manufacturing and the freight networks and physical supply chains at the base. This asymmetry is not a flaw in the framework. It is the single most useful thing it reveals, because the lag between layers is where anticipation becomes possible.
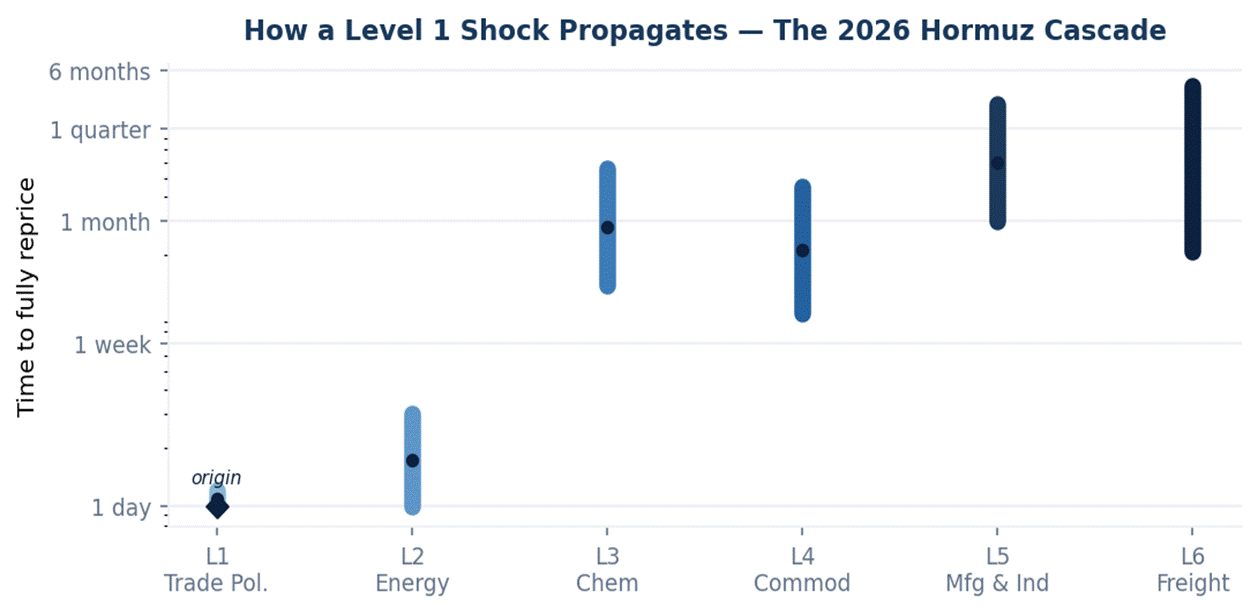
How a Level 1 Shock Propagates — The 2026 Hormuz Cascade (illustrative) | Source: The Meridian analysis
The 2026 Strait of Hormuz crisis was a live demonstration of this principle from beginning to end. The shock originated in trade policy and geopolitics, the head of the framework, when conflict disrupted roughly 14 million barrels per day of oil supply. Energy moved first and fastest, with prices repricing within hours. Chemicals followed over the subsequent weeks as naphtha feedstock costs worked through to polymer and specialty prices. Commodities and industrial activity adjusted on their own timelines, and freight rates took longest of all, because rerouting fleets and repricing tanker and container capacity is a physical process measured in weeks to months, not a screen update measured in seconds. A reader who understood the cascade in March could see the chemicals and freight moves coming while they were still only visible upstream. That is the entire practical value of the framework: it converts a lag that most coverage treats as noise into a window of foresight.
When the war began to resolve, the same asymmetry ran in reverse. The paper markets celebrated the ceasefire and repriced energy downward in a single session, but the physical supply chain, the mined strait, the damaged infrastructure, the dispersed tanker fleet, could not follow at the same speed. The publication's argument through that period was consistent and grounded in the framework: watch the water, not the wire. The signature on a diplomatic document and the arrival of the first commercial cargo through the strait are different events on different clocks, and the difference between them was where the risk and the opportunity lived.
The Weekly Cadence
The publication moves through the framework one layer at a time across the week, with each article published at 9:00 AM CST. The rhythm is deliberate. Covering one layer per day gives each vertical the depth it deserves rather than compressing the whole framework into a single overwhelming digest, and it lets the cascade analysis in each article reference the layers already covered earlier in the week.
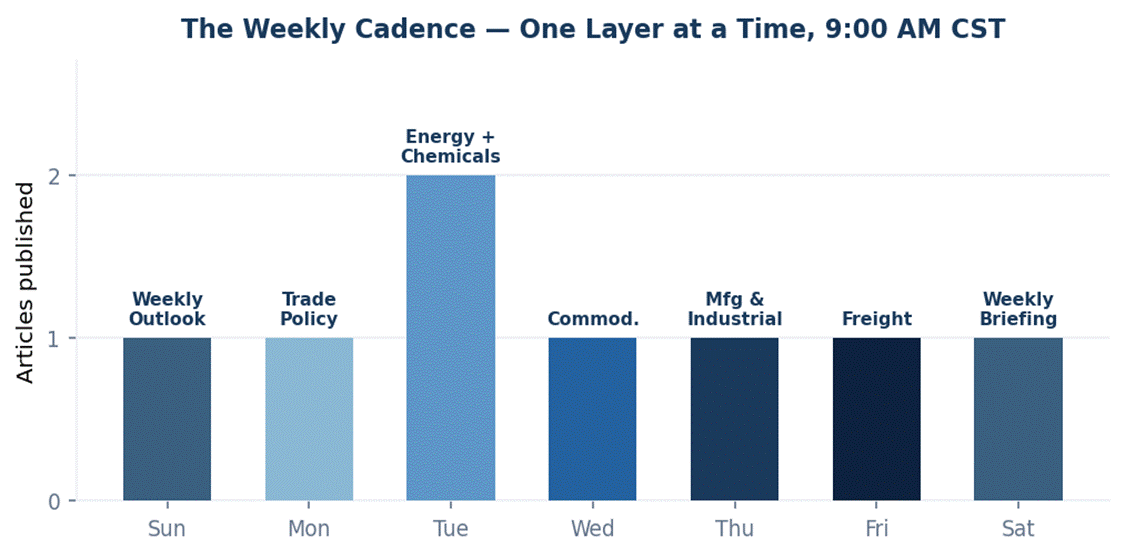
The Weekly Cadence — One Layer at a Time, 9:00 AM CST | Source: The Meridian
The week opens on Sunday with a Weekly Outlook and Signals Report, a concise executive brief on what to watch in the days ahead. Monday covers trade policy and geopolitics, the head of the framework and the layer most likely to originate the week's largest shocks. Tuesday carries two articles, energy and chemicals, the two layers a policy shock tends to move first. Wednesday covers commodities. Thursday covers manufacturing and industrial development, where inputs become finished goods and productive capacity. Friday covers freight rates and trends, the most downstream layer, where the upstream disruptions of the week show up as the cost of movement. Saturday closes the week with a briefing and a compiled document that assembles the week's coverage into a single reference. By the time the week ends, the reader has moved through the entire framework in sequence and seen how each layer connected to the others.
Executive Takeaway
- Every article now leads with an argument, not a recap. The editorial states a defensible position on the single most important development in the vertical, because judgment is the scarce commodity now that facts are free and instant.
- The fixed updates cover the full landscape of each vertical, every issue. An energy article covers the whole energy complex, not just crude. A chemicals article covers the whole chemicals market, not a single thread. The reader should not need to look anywhere else for the complete picture.
- Graphs appear in every data carrying issue, in two forms. Charts are embedded in the document alongside the analysis, and a companion visual file renders the same charts for the web, both in one consistent visual language.
- Every article closes with Effect on the Framework. The cascade analysis traces how one layer's developments move the others, which is what makes the publication a system rather than a set of separate reports.
- The Global Trade Framework is a six layer model of how disruption cascades. Trade policy and geopolitics, energy, chemicals, commodities, manufacturing and industrial development, and freight rates and trends, with trade policy and geopolitics positioned at the head as the tier most likely to originate the largest shocks.
- The layers reprice on different clocks, and the lag is the opportunity. Paper markets move in hours, physical supply chains in weeks to months. Understanding the sequence converts that lag from noise into foresight.
Signals to Watch
Signal 1: The Editorial's Thesis, Every Issue
The fastest way to read any article is to find the argument first. Each editorial states a position in its opening paragraphs. If a reader takes only one thing from an issue, it should be that thesis, because everything else in the article exists to support or test it.
Signal 2: The Fixed Update Sections You Care About Most
Because the update sections are consistent from week to week, a reader can track a single category, a specific rate lane, a particular feedstock, a given policy, over time and build a compounding understanding. Find your sections and follow them across issues.
Signal 3: The Charts as a Quick Read
When time is short, the graphs carry the essential quantitative story on their own. A reader who scans only the editorial and the charts will still leave with the argument and the evidence for it.
Signal 4: The Effect on the Framework Section
This is where the week's developments connect to the reader's own layer, even when the reader's primary interest is a different vertical. A freight professional should read the energy article's framework section, because that is where the energy shock becomes a freight cost.
Signal 5: The Sunday Outlook and Saturday Briefing
The week's bookends. Sunday sets up what to watch. Saturday assembles what happened and what it meant. Together they let a reader engage with the full framework even in a week when they cannot read every daily issue.
Effect on the Framework
Level 1: Trade Policy & Geopolitics
As the new head of the framework, this layer gets coverage that reflects its role as the primary originating force, tracking tariffs, sanctions, export controls, treaties, and conflict, and mapping how each decision radiates down through energy, chemicals, commodities, manufacturing, and freight. Every other article's framework section now references the policy layer explicitly as the likeliest source of the week's largest moves.
Level 2: Energy
Energy coverage expands from a crude oil price update to the full complex, crude, natural gas and LNG, refinery margins, production, power, and policy, so that the first market a geopolitical shock typically moves is documented in the depth its downstream influence demands.
Level 3: Chemicals
Chemicals coverage spans feedstock economics, polymers, specialty and fine chemicals, agricultural chemicals, and regulation, with the editorial identifying which of those threads matters most in a given week rather than defaulting to whichever one is loudest.
Level 4: Commodities
Commodities coverage treats grains, metals, energy commodities, and softs as a full landscape, with fund positioning, crop and weather data, global production, and the policy backdrop each getting consistent attention rather than episodic mention.
Level 5: Manufacturing & Industrial Development
The framework's newest layer covers the point where upstream inputs become finished goods and productive capacity, tracking industrial output, capacity investment, reshoring and nearshoring, factory activity, and the manufacturing demand that translates raw inputs into the freight that moves them.
Level 6: Freight Rates & Trends
Freight coverage spans all modes, containerized ocean by lane, dry bulk, liquid bulk, air, full truckload, less than truckload, domestic liquid bulk trucking, and rail and intermodal, so the most downstream layer, where every upstream cost finally lands, is measured completely and closes the weekly sequence.
Citations
— The Meridian. 2026. 'Energy: The Day the Paper Market Moved and the Physical Market Did Not.' Anchor reference to June 15, 2026 Energy issue.
— Al Jazeera / IEA. 2026. 'Over 14 Million Barrels Per Day Offline From the Strait of Hormuz Conflict, Roughly 14% of Global Demand.' AlJazeera.com. June 2026.
— The Meridian. 2026. 'Chemicals: Watch the Water, Not the Wire.' Anchor reference to June 16, 2026 Chemicals issue, documenting naphtha to polymer feedstock cascade timing.
— CNBC. 2026. 'Oil Tanker CEO Sees Hormuz Ship Traffic Quickly Increasing if US and Iran Reach a Deal.' CNBC.com. June 11, 2026. https://www.cnbc.com/amp/2026/06/11/iran-strait-hormuz-oil-tanker-traffic-frontline.html