
The Day the Paper Market Moved and the Physical Market Did Not
Crude Fell 5% This Morning on the Iran MOU Announcement. The Strait Is Still Mined. The SPR Is at a 43-Year Low. Qatar's Ras Laffan Is Damaged. Citi Says $70 by Q4. The Math Is More Complicated Than a Headline.
Global Trade Framework | Level 2 | Energy
Editorial: The Asymmetry Nobody Is Talking About
Late Sunday, President Trump and Iran's Deputy Foreign Minister Kazem Gharibabadi announced a Memorandum of Understanding to end fifteen weeks of conflict, with a formal signing ceremony scheduled for Friday, June 19 in Geneva and mediated by Pakistan.[1] Crude oil fell about five percent this morning. WTI dropped to around $80.50 and Brent to roughly $83.[2] Combined with Friday's decline, crude has shed about eight percent in two sessions. Citi, moving fast, cut its Brent forecast to $75 in Q3 and $70 in Q4.[3]
Here is the thing worth sitting with before anyone adjusts their fuel cost assumptions or unwinds a hedge. The paper market moved. The physical market has not.[4]
As of Monday afternoon, according to Argus Media, tanker traffic through the Strait of Hormuz was unchanged from last week. The deal is announced. It is not yet signed. It is not yet implemented. And between the announcement and actual crude flowing through the Strait at pre-conflict levels, there is a sequence of physical events that cannot be compressed by diplomatic optimism.
Consider what that sequence requires. The Strait needs to be demined as Iran laid mines during the conflict. Clearing them is a methodical, weeks-long process that does not accelerate because markets want it to. Qatar's Ras Laffan LNG facility, one of the most important energy infrastructure sites in the world, sustained damage during the conflict and is not ready to resume full operations.[5] Insurance markets, which canceled war risk coverage on Gulf transits in March, will not reinstate commercial rates until underwriters have assessed sustained, verified, uneventful transit patterns for a period that typically runs thirty to sixty days after a formal security change. Tankers that rerouted to the US Gulf Coast, West Africa, and Brazil need time to reposition to the Gulf — the Frontline CEO told CNBC last week that vessels completing current deliveries are roughly thirty days from the Persian Gulf.[6]
The IEA has confirmed that over 14 million barrels per day — roughly 14 percent of global demand — has been offline due to the conflict.[7] Getting that back online is not a switch. It is a sequence. Producers need to assess well conditions after weeks of shutdown, some of which may have experienced pressure loss or water contamination that requires remediation before production can resume. OECD inventories are at historically depleted levels and need to rebuild from a low base. The US Strategic Petroleum Reserve sits at 340.3 million barrels as of June 12, a 43 year low, and will need to be replenished over time.[8]
Citi's $70 Q4 forecast is not impossible. But it requires all of those steps completing on an accelerated schedule while simultaneously managing the one risk factor that markets are currently under-pricing: the toll dispute.
Iran's state media outlet Mehr has already reported that the Strait will reopen under 'Iranian arrangements,' and Iranian officials have explicitly stated that Iran and Oman will impose fees for navigation safety and security services after a 60-day toll free window.[9] Trump has insisted the Strait will be permanently toll free.[9] That is not a minor semantic disagreement. It is a direct contradiction about a fundamental commercial question — who controls access to the Strait and on what terms — that is unresolved in the MOU text and represents the single most likely source of re-escalation during the 60-day negotiation window.
The 60-day window also covers Iran's nuclear program, sanctions, and regional stability. Trump stated that Iran would be allowed low-level nuclear enrichment despite that being the stated justification for the war.[10] That ambiguity exists alongside the toll disagreement inside an MOU whose formal text has not yet been released as of this writing. Organizations that are rapidly repricing their energy cost assumptions based on Monday's crude decline should at minimum be keeping a re-escalation scenario on the table.
Today's paper price move tells you where traders think this is going. It does not tell you when the physical market gets there. Those are different questions, and right now the gap between them is measured in weeks to months, not days.
Crude Oil
Prices, the Deal Move, and What Comes Next
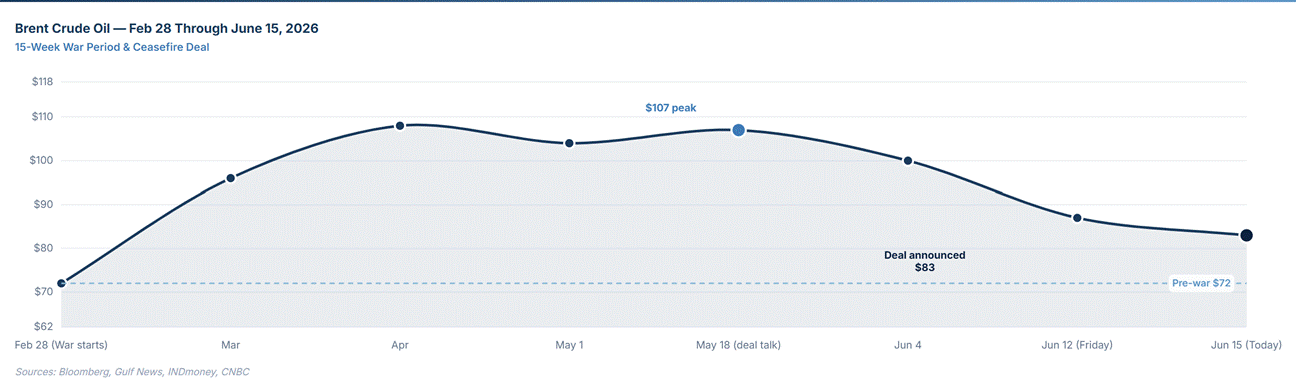
WTI is trading near $80.53 to $81 per barrel this morning and Brent near $83 to $83.38 — their lowest levels since early March.[2][11] The move reflects the unwinding of a geopolitical risk premium that built up from roughly $72 prewar to a peak above $100 in May. Friday already took three percent off, and Monday's announcement delivered another five percent.[2] The paper market is moving fast.
Citi's revised forecast of $75 per barrel in Q3 and $70 in Q4[3] is now in the conversation, but it requires a specific set of conditions. It requires the demining of the Strait to complete without incident, LNG infrastructure at Ras Laffan to resume operations on an accelerated timeline, insurance markets to normalize, tanker repositioning to place available capacity in the Gulf, and global crude production to restart in an orderly and complete way. None of those steps are guaranteed, and any one of them slipping — let alone the toll dispute producing a re-escalation — pushes the timeline out and keeps the price higher than Citi's forecast implies.
Worth noting separately: the US exported almost as much crude as it imported in April, and US net petroleum product exports are running 0.6 million barrels per day above last year.[12] The US has functioned as a global refinery and crude export backstop during the disruption. That role will gradually diminish as Gulf supply restores, and US refiners who have benefited from elevated crack spreads and export demand will face some margin compression. The timeline for that compression tracks the physical reopening sequence, not the paper price move.
UK, France, Germany, Italy Signal Sanction Readiness
The UK, France, Germany, and Italy immediately welcomed the deal and signaled readiness to lift their own sanctions on Iran contingent on verified nuclear program steps.[13] If those sanctions lift and Iran's full oil export capacity comes back online — which would be months after signing, not days — the combined supply addition from Iranian production fully resuming is significant. Iran was producing approximately 3.3 million barrels per day before sanctions were tightened and the conflict began. The pace of that restoration, which depends on production infrastructure condition and marketing relationship rebuilding, is another variable in the supply normalization timeline.
US Domestic Energy
The SPR at a 43-Year Low
The US Strategic Petroleum Reserve fell to 340.3 million barrels as of June 12 — the lowest level since the summer of 1983.[8] The administration withdrew approximately 75 million barrels from Gulf Coast salt caverns since the conflict began, including an 8.9-million-barrel draw last week, the third-largest single-week withdrawal on record.[8] Total US oil inventories, combining commercial stocks and the SPR, have dropped 79 million barrels to levels not seen since 2023.[8]
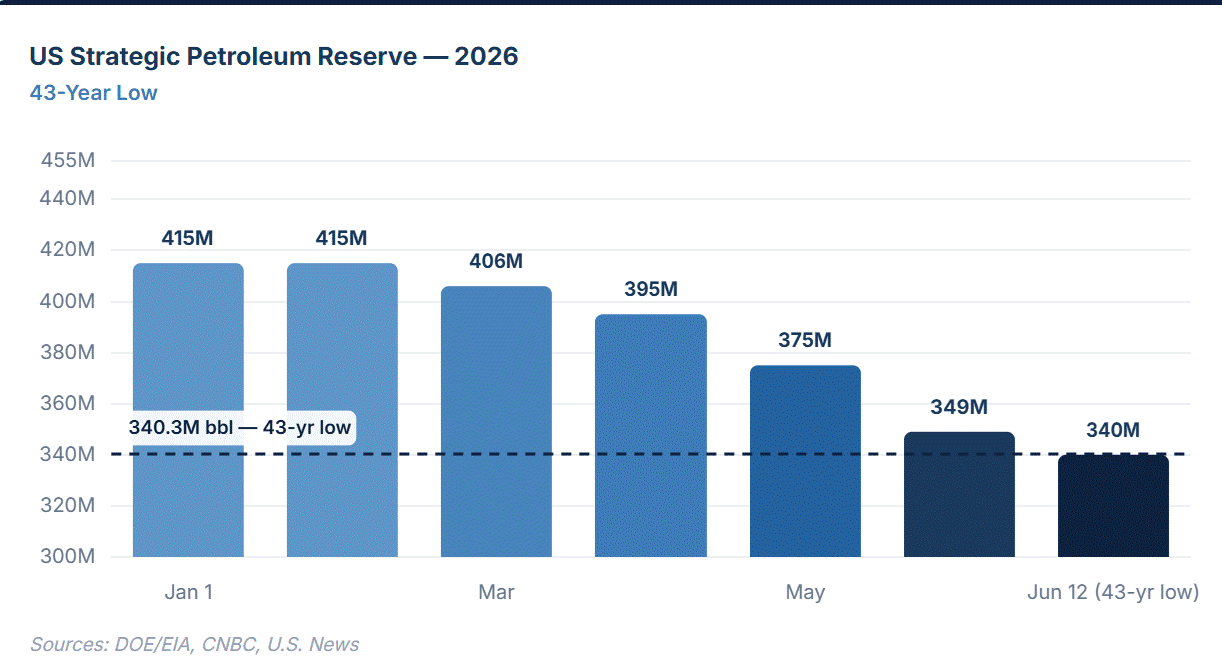
The SPR drawdown has been one of the mechanisms moderating what would otherwise have been even higher consumer fuel prices during the disruption. The price of that mechanism is a reserve buffer that is now substantially smaller than it was when the conflict began. Replenishing it will require sustained periods of lower crude prices and active purchasing decisions, which takes time and competes with other fiscal priorities. Hurricane season, which began June 1, is the specific near term risk that makes the depleted SPR most relevant — a significant Gulf Coast hurricane event could stress both crude production infrastructure and refinery capacity at the same time the reserve cushion is at its weakest point in four decades.
Production and Pump Prices
US crude production came in at 13.8 million barrels per day for the week ended June 5 — up 92,000 barrels per day week over week, up 371,000 barrels per day year over year, and the highest level since January 2026.[14] The Baker Hughes rig count stands at 562 total rigs, up steadily for eight consecutive weeks from an early April low, with oil rigs up two this week and gas rigs down three. The Permian count is down one week over week and down 17 rigs year over year, reflecting the capital discipline dynamic that has characterized shale producers through this price cycle.[14]
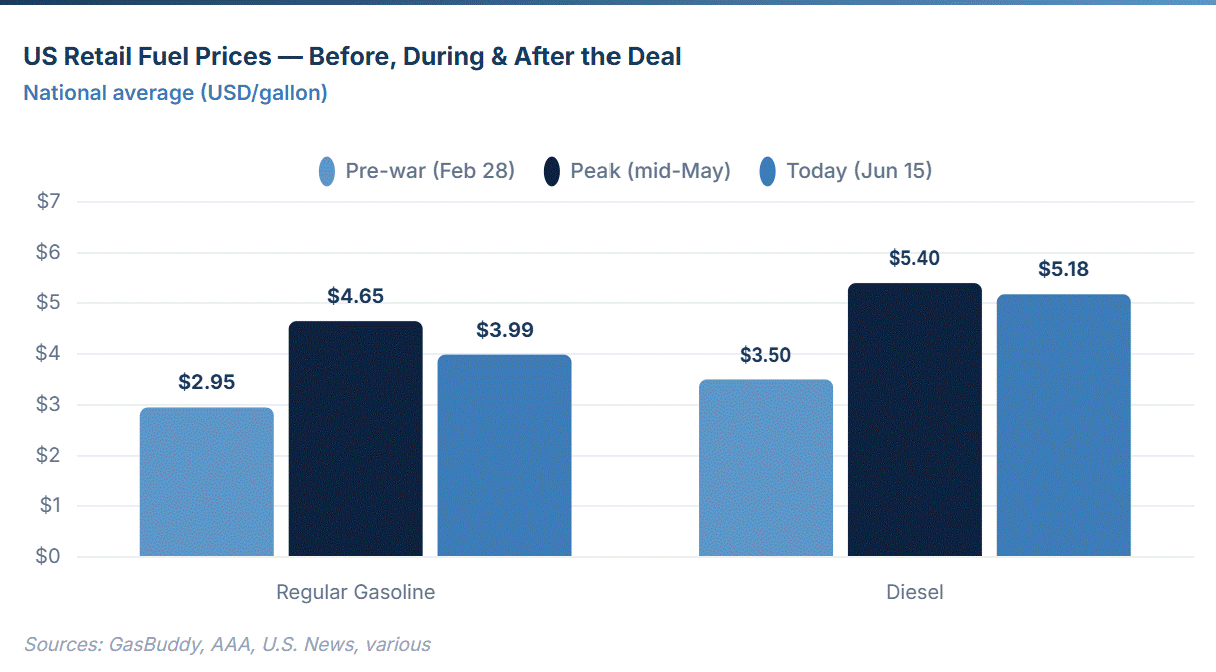
On the demand side, the national average gasoline price dipped below $4 per gallon for the first time since mid-April. GasBuddy recorded $3.99 per gallon nationally as of Sunday, with AAA at $4.065 Monday morning.[15] That is still up about 90 cents year over year. National average diesel stands at $5.182 per gallon, down 11.7 cents in the past week but approximately $1.74 above year-ago levels.[16] The total extra cost to US consumers from higher fuel prices over the 15-week conflict period has been estimated at roughly $40 billion.[17]
Natural Gas and LNG
Henry Hub, the Storage Build, and the Winter Forward
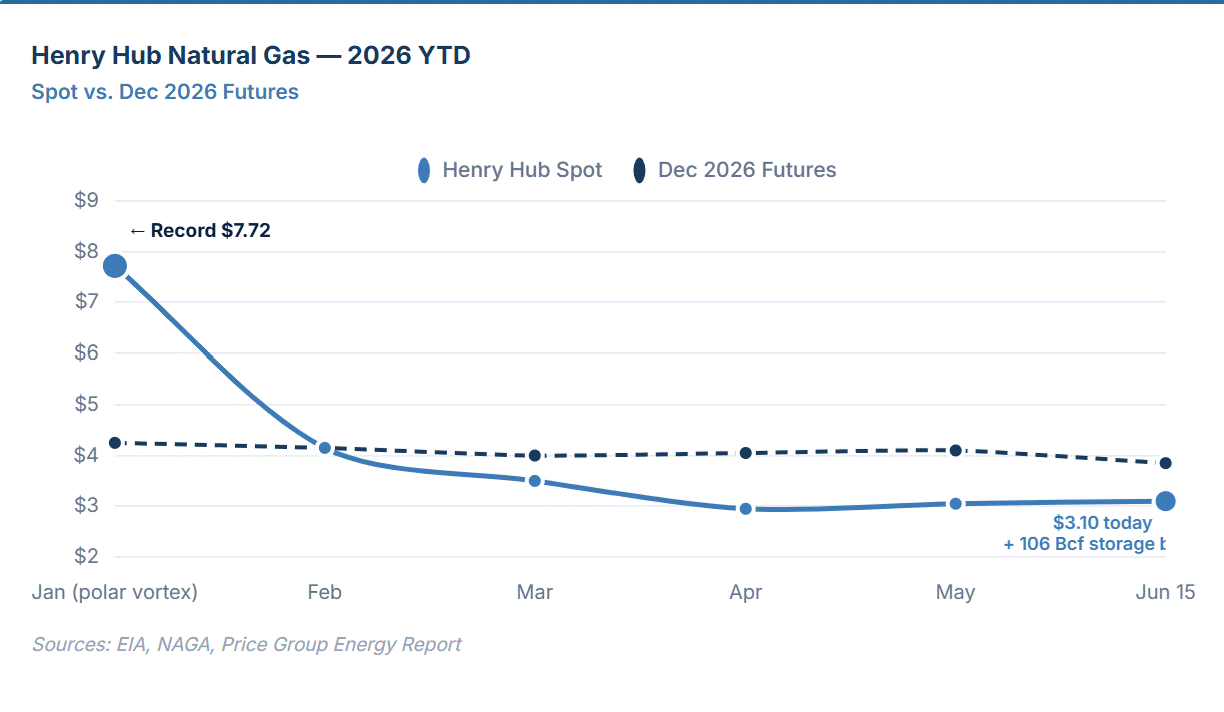
Henry Hub July contract is trading near $3.07 to $3.14 per MMBtu this morning, having rebounded somewhat after last week's EIA storage report showed a +108 Bcf build — above expectations and above the five year average.[18] Near-term prices are range-bound: mild early-summer temperatures have weighed on power burn demand, with warmer weather expected to pick up cooling demand in the weeks ahead. Despite the storage build being nominally bearish, LNG export flows surged 11.9 percent in the same period, partially absorbing what would otherwise have been an even larger storage surplus.[18]
The forward curve continues to tell a different story than the spot price. December 2026 futures are holding above $4 per MMBtu, the market's clearest expression of the expectation that winter will reassert the bull case — through LNG export ramp-ups from Plaquemines, Corpus Christi Stage 3, and Golden Pass LNG, plus data center power demand as a structural new load floor. The polar vortex in January 2026 set a record monthly average of $7.72 per MMBtu, and while no one is forecasting a repeat, the December premium reflects the market's awareness of what a cold winter can do in this supply-demand configuration.
European Gas: TTF Down 6%, But the Winter Gap Persists
European wholesale gas, measured by the Dutch TTF benchmark, fell 6 percent today to €43.60 per megawatt-hour — its lowest level in five weeks — on Hormuz deal optimism.[19] European equity markets simultaneously hit record highs. But the headline move does not resolve the structural winter supply concern: European gas storage remains 17 to 25 percent below seasonal averages,[5] and Qatar's Ras Laffan — which is both the world's largest LNG facility and a critical supplier to Europe — sustained damage during the conflict whose repair timeline has not been publicly specified. Winter 2026 to 2027 supply adequacy is a live risk even with the Strait reopening.
The Ras Laffan Factor
Qatar's Ras Laffan Industrial City, home to the vast majority of Qatar's LNG production capacity, sustained damage during the conflict period that has not been fully characterized publicly.[5] What is known is that Ras Laffan is one of the single most consequential LNG infrastructure sites in the world, responsible for a substantial share of global LNG supply. Any damage that requires extended repair will compress the recovery timeline for global LNG markets even as the Strait reopens. European buyers who were relying on Qatari LNG to rebuild storage toward winter adequacy levels are carrying meaningful supply risk into the second half of 2026 regardless of what the MOU says.
Coal
A Beneficiary of the LNG Gap — and Possibly a Victim of Its Resolution
Newcastle thermal coal futures are trading near $145 to $148 per tonne as of June 15 — broadly stable week over week but still elevated near 22-month highs.[20] China port inventories sit at approximately 2,321 kilotonnes, above both the 2025 trajectory and the five year seasonal average, suggesting limited near term demand-driven upside from that direction.[20]
Coal's specific relationship with the Hormuz disruption is worth understanding clearly. The LNG supply gap created by the Strait closure produced a direct demand uplift for thermal coal as utilities across Asia substituted it for natural gas in power generation. Signal Ocean's April data documented this substitution clearly — Asian natural gas buyers turned to coal when LNG became expensive or unavailable, contributing to the elevated coal price environment.[21] As LNG supply normalizes through the Strait reopening and Ras Laffan repair, that substitution premium begins to erode. Coal could be one of the first commodity beneficiaries of the conflict to see prices soften most directly as a result of the deal, precisely because its demand uplift was so specifically tied to the LNG supply gap.
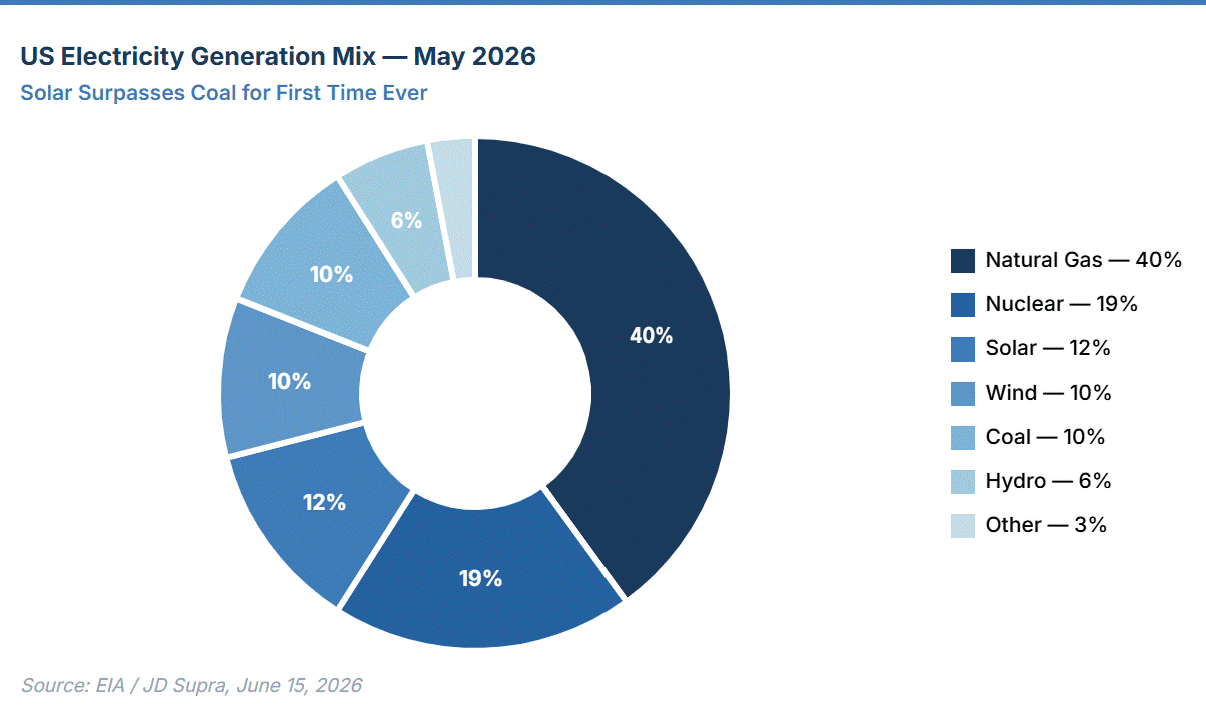
There is also a longer-run supply story worth noting this week. For the first time ever, solar supplied more US electricity than coal in May 2026, making solar the third-largest US electricity source behind natural gas and nuclear.[22] This is a structural milestone that does not reverse when energy markets normalize. The coal displacement by solar in US power generation is a secular trend, and May 2026 is the month it crossed a threshold that will not uncross.
Nuclear: Sweden Picks Rolls-Royce, China Pushes Fusion
Sweden Selects Rolls-Royce SMR — A Market-Consolidating Signal
Swedish state owned Vattenfall and its joint venture Videberg Kraft selected Rolls-Royce SMR to deliver three small modular reactors on the Värö Peninsula on Sweden's west coast — Sweden's first new nuclear capacity in more than 40 years.[23] The three units will add 1,500 megawatts of clean baseload capacity, with the first unit expected operational by the mid-2030s. Rolls-Royce SMR was chosen over GE Vernova and more than 70 other candidates evaluated since 2022.[23]
The strategic significance of this selection extends beyond Sweden. Rolls-Royce SMR has now won every competitively tendered SMR selection in Europe — the UK, Czech Republic, and now Sweden.[24] That is a market consolidation signal that the nuclear and energy finance community is tracking carefully. RYCEY, the Rolls-Royce US ADR, surged to March 2026 highs on the news.[24] For the European energy security conversation, which has been dominated by gas supply anxiety since 2022, SMRs are increasingly being treated as a credible long-term answer to baseload reliability rather than a speculative technology. The combination of European energy security concerns and AI-driven power demand is accelerating both political will and private capital interest in nuclear infrastructure across the continent.[25]
China's Fusion Push: The Scale of the Competition
Alongside the SMR news, China's fusion energy program deserves a specific update because the strategic context has shifted materially in 2026. China's 15th Five-Year Plan, covering 2026 to 2030, designates fusion energy as a frontline of great-power scientific competition, promising 'extraordinary measures' to secure breakthroughs. Annual Chinese government spending on fusion is estimated at approximately $1.5 billion — nearly twice the US federal fusion budget.[26]
The technical results are matching the investment. In January 2026, China's Experimental Advanced Superconducting Tokamak, known as the EAST reactor or the 'artificial sun,' breached what had been considered a fundamental limit in plasma physics. Published in Science Advances on January 1, the research demonstrated a 'density free regime' in which fusion plasma remained stable at densities far beyond the traditional Greenwald density limit — a barrier that fusion scientists had long considered a hard ceiling.[27] The work was co-led by researchers at Huazhong University of Science and Technology and the Chinese Academy of Sciences, and it changes how the field thinks about the path to ignition. Denser plasma, maintained stably, is a critical enabler for commercial scale fusion reactions.
China's broader fusion infrastructure makes the EAST result more significant, not less. Beijing launched China Fusion Energy Co. Ltd. in July 2025 with $2.1 billion in registered capital — 2.5 times the entire annual US Department of Energy fusion budget as a single entity.[26] The Xinghuo fusion-fission hybrid reactor is budgeted at $2.8 billion and targets first phase completion by 2031. China has at least five major fusion facilities under construction or in late-stage planning. The United States has none at comparable scale.[26]
This is not a near term energy supply story. Fusion energy is still a decade or more from commercial scale electricity generation under the most optimistic credible timelines. But it is a long-term energy security story, and the US-China divergence in fusion investment and achievement is one of the more consequential technological competitions underway. Also moving forward: General Fusion filed an effective SEC joint F-4 for a proposed business combination, a notable step toward a public market listing for a fusion company and a signal that capital markets are beginning to assign value to fusion development timelines.
Solar, Wind, and the Grid
Solar Becomes the Third-Largest US Electricity Source
May 2026 is the month solar power surpassed coal in US electricity generation for the first time in history, making solar the third-largest electricity source in the country behind natural gas and nuclear.[22] Solar is growing at 19 percent since 2023 per EIA data. Wind is up 10 percent over the same period. Natural gas is up 1 percent. Coal is down 2 percent.[22] The electricity mix is changing measurably and consistently, and May 2026 represents a structural milestone rather than a monthly anomaly driven by unusual weather conditions.
Residential Solar Stalls as Large-Scale Builds Accelerate
The headline solar number masks a significant divergence within the sector. BloombergNEF projects the US will add only 4.1 gigawatts of residential solar in 2026 — down 15 percent from 2025 and the lowest in five years.[28] Policy uncertainty and interconnection delays are the primary cited drivers. At the same time, utility scale and commercial solar continues its expansion, with tech companies and data center operators signing large power purchase agreements for dedicated renewable capacity at scale. Microsoft's PPA with Iberdrola for 150 megawatts of dedicated wind in Spain is one example of how hyperscalers are funding new capacity directly rather than competing for grid supply.[29]
Offshore Wind Retrenches; Grid Queues Stay Clogged
Shell confirmed today it is selling its offshore wind assets, continuing a broader retrenchment by major European energy companies from the sector.[30] Siemens Gamesa also issued a warning on offshore wind conditions.[30] The institutional capital retreat from offshore wind contrasts sharply with the continuing buildout of onshore solar and the SMR momentum described above.
The grid capacity picture remains one of the most important structural constraints in US energy.[31] Power Magazine's analysis published today notes that over 2,500 gigawatts of renewable, large-load, and storage projects are stalled in grid queues worldwide.[31] The US grid operates at roughly 70 percent capacity utilization overall but must hold enormous reserves for peak demand events driven by AI data centers and summer cooling loads. IFM Investors projects approximately 20 percent US load growth between 2024 and 2030 — roughly 150 gigawatts of new demand at a pace not seen in 20 years — driven by AI data centers, electrification, and domestic manufacturing reshoring.[32]
Energy Financial Markets
Sector-Wide Sell-Off on the Deal News
The broad energy sector is selling off today, with the move being sector wide rather than company specific — a repricing of the geopolitical risk premium that had been built into energy equity valuations since February. ExxonMobil fell approximately 5 percent from Friday's close near $147 to the $139 to $140 range intraday.[33] Chevron, ConocoPhillips, Valero, and Marathon Petroleum are all down 4 to 6 percent in parallel.[33] Energy sector investors who built positions around a sustained high-price environment are reassessing the timeline for normalization.
Deals That Are Not About Crude Oil
Three transactions announced today are worth tracking specifically because they represent capital allocation decisions about the future energy mix rather than reactions to today's crude price move.
Talen Energy closed its $2.55 billion acquisition of the Lawrenceburg Power Plant in Indiana and additional gas generation assets from Energy Capital Partners, bringing Talen's total installed generation to approximately 15.6 gigawatts including 2.2 gigawatts of nuclear.[34] Talen described the acquisition as tied directly to surging PJM power demand from data centers. A nuclear and gas generation platform being built specifically around AI power demand is the clearest possible statement of where this company sees energy market growth coming from.
Comstock Resources sold a 27 percent stake in its midstream subsidiary Pinnacle Gas Services to Sixth Street for $600 million, valuing Pinnacle at $2.2 billion enterprise value.[35] Proceeds were used to retire approximately $445 million in preferred equity and all Pinnacle debt — a balance sheet optimization timed to natural gas market strength. The deal values midstream natural gas infrastructure at a premium that reflects expectations about LNG export demand growth and the long-term natural gas role in power generation.
Blue Energy and Calcuta Resources announced a joint venture to develop a CO₂ sequestration project in Oklahoma's Anadarko Basin, with 3 to 5 million metric tonnes of storage capacity over its operating life.[36] Blue Energy is exploring a public listing. The transaction pairs continued US oil production with permanent carbon storage — a model that is gaining traction as an alternative to the binary choice between continuing fossil fuel production and achieving emissions reductions.
Executive Takeaway
- The paper crude price move is real; the physical supply restoration is not yet. WTI at $80 and Brent at $83 reflect traders pricing in a scenario. The Strait still needs to be demined, infrastructure repaired, insurance markets normalized, and tankers repositioned before physical supply reaches the levels that would sustain those prices. Build energy cost models around a range of scenarios, not a single trajectory.
- The toll dispute is the re-escalation risk that markets are under-pricing today. Iran's state media has already stated fees for navigation services after a 60-day window. Trump has said permanently toll free. That contradiction is unresolved in the MOU text and sits inside a 60-day negotiation window that also covers nuclear enrichment, sanctions, and regional stability. Any one of those going badly sends crude back up quickly.
- The SPR at a 43 year low heading into hurricane season is the domestic tail risk. 75 million barrels drawn since February. Hurricane season started June 1. The reserve cushion available to absorb a new supply disruption is the smallest it has been since 1983. Monitor Gulf Coast storm tracking alongside energy supply decisions.
- Rolls-Royce SMR has now won every competitively tendered SMR selection in Europe. UK, Czech Republic, Sweden. That is a market consolidation signal, and it reflects the maturation of SMR technology from concept to infrastructure decision. European energy investors and utilities should be watching the emerging timeline for these deployments as a long-term baseload supply variable.
- China's fusion program is a long-term energy security competition, not a near term supply story. The January 2026 EAST density free regime breakthrough and China's $2.1 billion state fusion company launch are part of a 15th Five-Year Plan that designates fusion as a great-power priority. The US is spending roughly half of China annually on fusion. The gap in investment and facility construction is widening.
- Solar surpassed coal in US electricity generation for the first time in May 2026. This is a structural milestone, not a monthly data point. The composition of US electricity generation is changing in a way that affects industrial energy cost planning, grid reliability planning, and capital allocation decisions across the full energy sector.
Signals to Watch
Signal 1: MOU Formal Text Release — Especially the Strait Governance Language
The White House promised the formal MOU text within 48 hours of Sunday's announcement. The specific language on Strait governance — whether it contains the toll and fee framework that Iran has described or the permanently toll free framework Trump has insisted on — is the single most important data point of the week. Watch for any published text from the US State Department, Iran's Foreign Ministry, or the Pakistani mediation team.
Signal 2: Tanker Transit Data Through the Strait
Argus Media confirmed Monday afternoon that tanker traffic through the Strait was unchanged from last week despite the announcement. Watch Kpler and Vortexa daily vessel tracking data for any increase in commercial transit volume. A sustained increase above 50 vessels per day including tankers would be the first physical supply signal, separate from any paper market move.
Signal 3: Lloyd's JWC Persian Gulf Listed Area Status
War risk insurance normalization is the gate between a political announcement and commercial shipping operating normally. Watch for any indication that the Lloyd's Joint War Committee has convened or scheduled a review of the Persian Gulf listed area designation. That review, and any subsequent modification, is what enables carriers and tanker owners to operate on commercial insurance terms rather than at-risk or under extraordinary premium arrangements.
Signal 4: Geneva Signing Ceremony on June 19
Whether the Friday ceremony in Geneva proceeds as announced, who attends, and whether the formal signing occurs will be the next major milestone. A signed document changes the legal and diplomatic status of the conflict more than Sunday's announcement. Watch for any changes to ceremony logistics or Iranian confirmation of participation.
Signal 5: Ras Laffan Damage Assessment and Repair Timeline
Qatar has not publicly characterized the extent or repair timeline for damage at Ras Laffan LNG. Any official statement from Qatar Petroleum or the Qatari government about the repair scope, timeline, or production restoration schedule would be the most important LNG supply variable for European winter planning. This is the data point that could most change the European gas storage picture for winter 2026 to 2027.
Effect on the Framework
Level 2: Chemicals — The Naphtha Gate Has Not Opened Yet
The oil price decline does not start the cracker restart clock. Naphtha physical availability to Asian crackers requires commercial tanker operations through the Strait under workable insurance, which requires the Lloyd's JWC listed area modification, which requires demonstrated sustained safe transit for 30 to 60 days after the Strait physically opens. Asian cracker operating rates, currently around 50 to 55 percent, will not recover until that sequence completes — regardless of what paper crude does this morning. The India zero-duty window on 40 petrochemical products expires June 30, creating a three-week procurement urgency that exists independent of any Hormuz resolution. European plant closures under naphtha and energy cost pressure will not reverse just because oil fell 5 percent today.
Level 3: Commodities — Energy Costs Down, But Grain Markets Have Already Moved On
Grain and oilseed markets explicitly divorced from crude oil in early June and have been trading weather as the primary variable since. Lower diesel prices benefit US farmers through reduced fuel costs, and a sustained crude price decline would eventually ease fertilizer costs — but the spring nitrogen application decisions that are driving this year's crop condition data are already made and cannot be undone. The June WASDE released last Thursday confirmed the supply picture across corn, soybeans, and wheat. Lower energy prices modestly improve the input cost picture for fall 2026 planting but do not change the fall 2026 harvest outcome. The New World Screwworm situation in Texas remains a separate livestock market variable unconnected to energy prices.
Level 4: Trade Policy — The Deal Changes the Diplomatic Context, Not the USTR Calendar
The 60-day negotiating window that follows Friday's signing will dominate diplomatic attention and may affect how aggressively the Trump administration pursues other trade confrontations simultaneously. The USTR's Section 301 structural overcapacity investigation, with July determinations pending, operates on its own schedule and is not formally linked to the Iran MOU process. However, an administration consuming significant diplomatic bandwidth in Geneva negotiations during June and July has less capacity for simultaneous trade confrontations on other fronts. Watch for any signals that July USTR actions are being delayed or modified in the context of the broader diplomatic environment created by the Iran deal.
Level 5: Freight Rates — The Normalization Clock Starts at Physical Opening, Not Today
Container spot rates surged 23 percent the week of June 4 and another 3 percent last week on peak season demand entirely independent of Hormuz status. Those rates will not collapse because crude fell 5 percent today. The Cape of Good Hope routing that has been entrenched for over three months will not reverse until Lloyd's JWC modifies the Persian Gulf listed area, carriers plan and execute test voyages, and service schedules are rebuilt. DHL's 4 to 6 month normalization timeline from the date of physical Strait opening remains the most credible planning estimate. Full container freight normalization targeting Q4 2026 at the earliest. Ocean tanker rates face different dynamics: the early reopening window will produce a rate spike as repositioning demand exceeds locally available tanker supply, before settling toward normal. Dry bulk has been softening on its own China-driven seasonal cycle and is not the primary beneficiary of any Hormuz deal. Air freight remains tight on capacity utilization above 80 percent that has nothing to do with the Strait. FTL continues its domestic tightening driven by frontloading demand and driver shortage that crude oil prices do not directly address.
Citations
[1] AP / NPR. 2026. 'Trump and Iran Announce MOU to End 15-Week War; Signing Set for Geneva June 19.' Associated Press / NPR.org. June 14-15, 2026.
[2] Bloomberg / Gulf News / INDmoney. 2026. 'Oil Prices Fall 4.7-5.1% on Iran Deal Announcement.' Bloomberg.com / GulfNews.com / INDmoney.com. June 15, 2026.
[3] U.S. News / Citi Research. 2026. 'Citi Cuts Brent Forecast to $75 Q3, $70 Q4 on Iran Deal.' USNews.com. June 15, 2026.
[4] Argus Media. 2026. 'Tanker Traffic Through Strait Unchanged as Deal Announced.' ArguseMedia.com. June 15, 2026.
[5] The Guardian / Al Jazeera. 2026. 'Ras Laffan Damage and European Gas Storage at 17-25% Below Seasonal Averages.' TheGuardian.com / AlJazeera.com. June 15, 2026.
[6] CNBC. 2026. 'Oil Tanker CEO Sees Hormuz Ship Traffic Quickly Increasing if Deal Reached.' CNBC.com. June 11, 2026. https://www.cnbc.com/amp/2026/06/11/iran-strait-hormuz-oil-tanker-traffic-frontline.html
[7] Al Jazeera / IEA. 2026. '14 Million Barrels Per Day Offline from Conflict, 14% of Global Demand.' AlJazeera.com. June 15, 2026.
[8] CNBC / DOE / U.S. News. 2026. 'US SPR Falls to 340.3 Million Barrels, 43-Year Low; 75 Million Barrels Withdrawn Since War Began.' CNBC.com / USNews.com. June 15, 2026.
[9] The Guardian / Mehr News Agency. 2026. 'Iran Says Strait Will Open Under Iranian Arrangements, Fees After 60 Days; Trump Says Permanently Toll Free.' TheGuardian.com. June 15, 2026.
[10] New York Times. 2026. 'Deal Analysis: Trump Allows Low-Level Nuclear Enrichment Despite War Justification.' NYTimes.com. June 15, 2026.
[11] INDmoney / Gulf News. 2026. 'Crude Oil Price Update June 15, 2026.' INDmoney.com / GulfNews.com.
[12] EIA. 2026. 'June 2026 Short-Term Energy Outlook.' EIA.gov. June 9, 2026. https://www.eia.gov/outlooks/steo/
[13] The Epoch Times. 2026. 'UK, France, Germany, Italy Welcome Iran Deal, Signal Sanction Readiness.' TheEpochTimes.com. June 15, 2026.
[14] Hays Post / Baker Hughes. 2026. 'US Crude Production 13.8 Million bpd Week Ended June 5; Rig Count 562.' HaysPost.com. June 12-15, 2026.
[15] GasBuddy / AAA. 2026. 'National Average Gasoline $3.99 per Gallon Sunday; AAA $4.065 Monday.' GasBuddy.com / AAA.com. June 14-15, 2026.
[16] Substack / EIA. 2026. 'National Diesel Average $5.182 per Gallon, Down 11.7 Cents Past Week.' June 15, 2026.
[17] CA Energy Commission et al. 2026. 'Estimated $40 Billion Extra Consumer Cost From Higher Fuel Prices Over 15-Week Conflict.' June 2026.
[18] Price Group Energy Report / Industrial Info Resources. 2026. 'Henry Hub Near $3.07, +108 Bcf Storage Build, LNG Exports Surge 11.9%.' June 2026.
[19] OilPrice.com / The Guardian. 2026. 'Dutch TTF Gas Falls 6% to €43.60/MWh on Deal Optimism; STOXX 600 Hits Record.' OilPrice.com / TheGuardian.com. June 15, 2026.
[20] Brights Research / Goldmine. 2026. 'Newcastle Thermal Coal Near $145-148/tonne; China Port Inventories Above Seasonal Average.' June 2026.
[21] Signal Ocean. 2026. 'Asian Utilities Substituted Coal for LNG During Hormuz Closure.' April 2026.
[22] JD Supra / EIA / MD Counties. 2026. 'Solar Surpasses Coal in US Electricity Generation for First Time; Third-Largest Source in May 2026.' JDSupra.com / EIA.gov. June 15, 2026.
[23] Rolls-Royce / World Nuclear News / Bloomberg. 2026. 'Vattenfall Selects Rolls-Royce SMR for Three Units on Värö Peninsula, Sweden; First New Nuclear in 40+ Years.' June 15, 2026.
[24] Stocktwits / Bloomberg. 2026. 'RYCEY Surges to March 2026 Highs; Rolls-Royce SMR Wins Third Consecutive European Tender.' June 15, 2026.
[25] JD Supra. 2026. 'European Energy Security and AI-Driven Power Demand Fuel Nuclear Dealmaking Wave.' JDSupra.com. June 15, 2026.
[26] Coalition for a Prosperous America. 2026. 'Fusion and the Future of American Power — China vs. US Investment and Facility Comparison.' ProsperousAmerica.org. April 7, 2026. https://prosperousamerica.org/fusion-and-the-future-of-american-power/
[27] Liu, Jiaxing et al. 2026. 'Accessing the Density-Free Regime with ECRH-Assisted Ohmic Start-Up on EAST.' Science Advances 12(1). DOI: 10.1126/sciadv.adz3040. January 1, 2026.
[28] BloombergNEF. 2026. 'US to Add Only 4.1 GW Residential Solar in 2026 — 15% Below 2025, Five-Year Low.' BloombergNEF. 2026.
[29] Enki AI. 2026. 'AI Data Center Grid Strain — Power Halts Growth.' EnkiAI.com. April 2026. https://enkiai.com/data-center/ai-data-center-grid-strain-power-halts-growth-in-2026/
[30] Weather Guard Wind / Siemens. 2026. 'Shell Exits Offshore Wind Assets; Siemens Gamesa Warns on Sector.' WeatherGuardWind.com. June 15, 2026.
[31] Power Magazine. 2026. 'Over 2,500 GW of Projects Stalled in Grid Queues Worldwide.' PowerMag.com. June 15, 2026.
[32] IFM Investors. 2026. 'US Load Growth Projected at 20% Between 2024 and 2030 — 150 GW New Demand.' IFMInvestors.com. June 2026.
[33] Tickeron / Yahoo Finance. 2026. 'ExxonMobil Down ~5%, Chevron COP VLO MPC All Down 4-6% on Iran Deal.' Tickeron.com / YahooFinance.com. June 15, 2026.
[34] Business Insider. 2026. 'Talen Energy Closes $2.55B Acquisition of Lawrenceburg Power Plant and Gas Generation Assets From Energy Capital Partners — 15.6 GW Total.' BusinessInsider.com. June 15, 2026.
[35] Business Insider. 2026. 'Comstock Resources Sells 27% of Pinnacle Gas Services to Sixth Street for $600M; Pinnacle Valued at $2.2B Enterprise Value.' BusinessInsider.com. June 15, 2026.
[36] Business Insider. 2026. 'Blue Energy and Calcuta Resources JV — Anadarko Basin CO₂ Sequestration Project, 3-5 Million Metric Tonnes Capacity.' BusinessInsider.com. June 15, 2026.