
America's Diesel Squeeze Is a Global Refining Shortage, and Keeping Barrels at Home Would Buy Weeks, Not Relief
U.S. refiners are making record volumes of distillate, yet stocks sit 7 million barrels below the five-year low because exports are filling a world short of Gulf and Russian diesel. Washington has stepped back from a ban, and every published model shows why.

U.S. refiners are making record volumes of distillate, yet stocks sit 7 million barrels below the five-year low because exports are filling a world short of Gulf and Russian diesel. Washington has stepped back from a ban, and every published model shows why. Meanwhile the Henry Hub discount to Europe is the widest since 2022, and grid access is becoming a regional cost of building anything large.
Executive Takeaway
The 2026 fuel shock has changed character. It began in March as a crude shock, when Brent jumped from about $71 a barrel in February to an April average above $117. It has since become a middle-distillate shock layered on top of still-elevated crude. On EIA spot data, the New York Harbor diesel premium over Dated Brent nearly tripled between February and September, to $94.64 a barrel, while the gasoline premium fell back after July. Retail diesel reached about $6.57 a gallon on September 28, up roughly three-quarters from a year earlier, and record diesel margins were assessed on the Gulf Coast and in Singapore in the past two weeks, with Northwest European gasoil margins near $99 a barrel.
The most important point for executives is that the United States is not short of refining output; it is short of inventory. Distillate production has averaged 5.08 million barrels a day this year, above every recent year, and domestic consumption is broadly flat. Exports, averaging 1.48 million barrels a day, are the principal identifiable reason that stocks of 107.4 million barrels on September 18 sit below the 2021–25 low for the week. Those exports are the market's response to refinery losses in the Gulf and Russia, not a discretionary U.S. choice that created the shortage. Usable refining headroom is limited: utilization peaked at 98% in late August, about 550,000 barrels a day of U.S. capacity has closed since 2025, and refiners have deferred maintenance into 2027.
That is why the export-ban debate of the past week matters even after the White House denied a 90-day ban on September 23 and Energy Secretary Wright said a ban "definitely doesn't work." Wood Mackenzie, S&P Global and Goldman Sachs all model the same arc: perhaps a month of cheaper diesel, concentrated on the Gulf Coast, while storage fills, then refinery run cuts of about 2 million barrels a day or more, higher gasoline prices and higher European diesel. East Coast relief would be capped by pipeline capacity. Talk has shifted toward narrower "tweaks," including wider use of tax-exempt dyed diesel, which would change what users pay without adding a barrel.
Gas is moving in the opposite direction. Qatar's export collapse is mostly a transit problem, with a durable core: two trains, 12.8 million tonnes a year, are out for three to five years. U.S. LNG exports, 17.4 billion cubic feet a day in the first half, have become increasingly central to balancing the Atlantic market, yet record U.S. production and above-average storage have kept Henry Hub near $3 while European and Asian benchmarks trade around $24–26. The competitiveness shift is visible now in European ammonia and acetyls, not in U.S. gas costs. Convergence is a 2027–2030 question that depends on whether production keeps outrunning a liquefaction fleet that could grow about 70% if every sanctioned project arrives.
On power, the edition's third finding is that grid access is becoming a location-specific investment screen rather than a national wall. PJM's 2028/29 capacity auction cleared at its $325/MW-day cap and 6,831 MW short of its reliability requirement; ERCOT has paused energization for new large data-center loads; and large-load tariffs with minimum-demand and collateral terms have been approved in 25 states. But requested load collapses once money is required: AEP Ohio's 30-plus gigawatts of interest became 5.6 GW of signed contracts. DOE's new SPARK selections, about 23 GW of additional transfer capability, are useful but mostly arrive from 2028.
Across all three stories, the structural and the temporary need to be kept apart. Hormuz transit, emergency policy and refinery outages are temporary in principle; refinery closures, damaged Qatari trains, PJM's reserve shortfall and transformer lead times above two years are not. Procurement teams should budget for elevated distillate costs through the winter, treat any Hormuz normalization as a faster fix for European and Asian gas than for U.S. diesel, and screen industrial sites for deliverable grid capacity and tariff terms, not just price per kilowatt-hour.
The Diesel Shock Is a Refining Shortage, and an Export Ban Would Relieve the Gulf Coast for About a Month
A product shortage on top of a crude shock
The price data show two different shocks in sequence. Crude drove the first: Brent's monthly average rose from $70.89 a barrel in February to $117.29 in April, while the New York Harbor ULSD premium over Dated Brent was actually lower in April than in March. The second leg belongs to products. Between April and August, Brent fell by about $26 while the diesel premium widened by about $38, to $87. By September, month-to-date through September 22, it had reached $94.64, compared with $28.87 for 2025 as a whole.
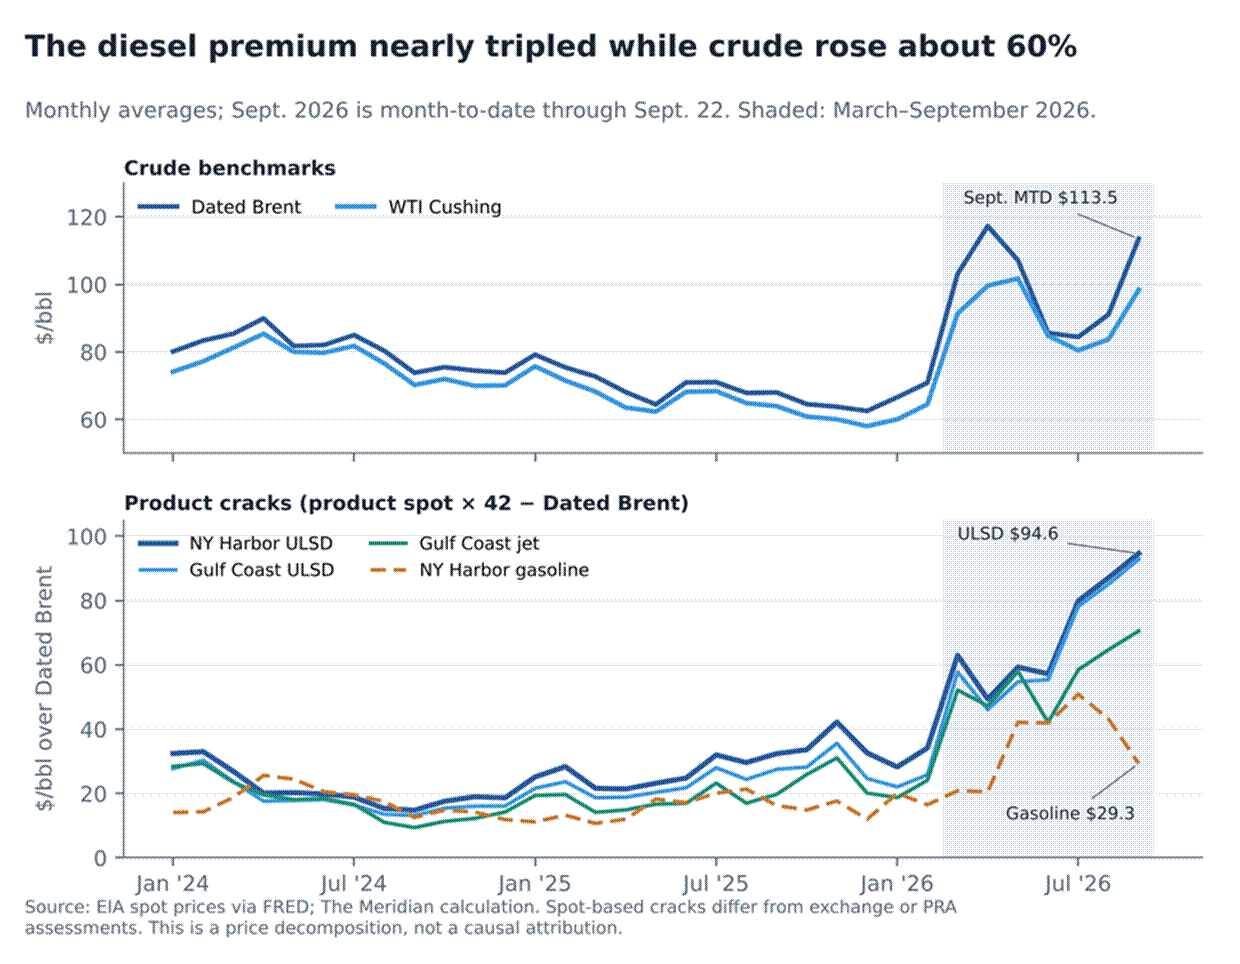
Crude drove the March–April leg; the April–August divergence, when crude fell and the diesel premium widened, is the clearest sign of product-specific scarcity. The gasoline premium has fallen since July.
A simple decomposition of the February-to-September rise in New York Harbor ULSD, from about $105 to $208 a barrel, puts roughly 59% of it in the crack and 41% in crude. That is accounting, not causation: the product price equals crude plus the crack by construction. The causal evidence lies elsewhere, in inventories, export flows and refinery outages, and in the gap between products. In September the diesel premium was about 3.2 times the gasoline premium, and EIA notes the New York Harbor distillate crack has averaged 74 cents a gallon above gasoline since March. Kansas State University's decomposition of the retail price, an analytical exercise rather than an EIA finding, reaches a similar conclusion from a different angle: of the increase from February to early September, crude contributed 68 cents a gallon and refining and distribution margins $1.71.
The scarcity is global. S&P Global assessed the U.S. Gulf Coast ULSD crack at $104.66 a barrel on September 22, after a record $105.42 on September 15; Singapore's gasoil crack hit a record $83.02 on September 16, against a 2025 average of $18.16; and ICIS put the Northwest European gasoil crack near $99 on September 18, with European jet stocks 55% below a year earlier. Part of this is a prompt-delivery premium: Dated Brent traded about $11 above front-month futures on September 22–23, and that component could deflate quickly if Gulf flows normalize.
Why U.S. stocks are falling while output runs at a record
U.S. distillate production has averaged 5,078 thousand barrels a day this year through September 18, against 4,903 in 2025; reported product supplied, the proxy for domestic demand, is essentially flat at 3,815 against 3,792. Exports have risen to 1,481 thousand barrels a day from 1,267. The surplus of production over domestic use grew by about 150,000 barrels a day, but exports grew by more than 210,000, and stocks fell. On September 18 they stood at 107.4 million barrels: 12.7% below a year earlier, 14.6 million barrels below the 2021–25 average for the week and 7.0 million below the lowest level of that period. A Reuters column described them as the lowest for the time of year in more than 40 years.
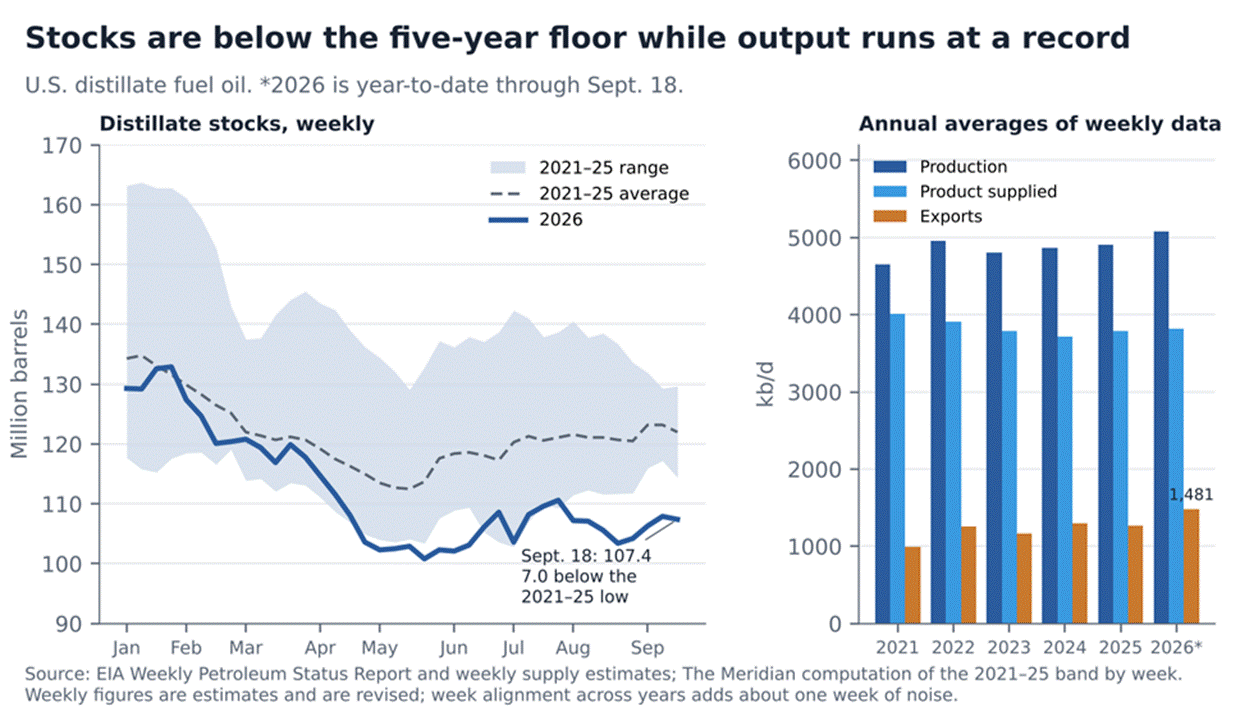
Stocks fell below the five-year floor in spring and have stayed there. Production has been above the 2021–25 average almost every week; the deficit reflects rising exports.
The precise statement is that high exports are the principal identifiable reason inventories fell despite high production and broadly flat reported demand. Imports, regional logistics, refinery yields, renewable diesel and weekly estimation revisions also move the balance. And the exports are a response, not a cause: they are filling a hole left abroad. Industrial Info Resources estimated that about 9% of global refining capacity was offline in May. Gulf net diesel exports averaged about 390,000 barrels a day in August, roughly a quarter of pre-war levels, and the Gulf and Russia together were exporting about 1.6 million barrels a day less diesel in August than in February, according to Kansas State's analysis. Drone strikes have shut Russia's Kirishi refinery and cut Volgograd and NORSI to about a quarter of capacity, and Moscow's ban on producer diesel exports runs to September 30.
Europe has become the swing buyer. U.S. distillate exports to Europe averaged 360,000 barrels a day in the first half of 2026, against 204,000 a year earlier, while Latin America's intake slipped slightly to 925,000. Wood Mackenzie estimates Europe took about half of U.S. diesel exports in September, against roughly 30% in 2025. That makes any U.S. restriction a transatlantic price event, not only a domestic one.
Regional buffers are thin where they matter most. Of the 107.4 million barrels, the Gulf Coast holds 44.4 million; the East Coast holds 22.2 million, of which New England holds only 2.65 million. The East Coast depends most on pipeline and waterborne supply, which is why it would gain least from keeping Gulf barrels at home.
Little usable headroom
Refinery utilization reached 98.0% in the week of August 28, the highest since August 2018, and was 94.0% on September 18 as autumn maintenance began, with the Gulf Coast at 96.5%. U.S. operable capacity of 18.03 million barrels a day is about 5% below its pre-pandemic level after the closures of LyondellBasell's Houston refinery, Phillips 66's Los Angeles plant and Valero's Benicia refinery removed about 550,000 barrels a day since 2025. National utilization does not prove there is zero idle capacity, but the usable incremental headroom for distillate is limited.
Refiners have also borrowed from next year. Industrial Info Resources data show planned crude-unit outages for autumn 2026 about 144,000 barrels a day below pre-war plans and autumn 2027 outages about 283,000 barrels a day higher. That supports supply now and concentrates turnaround demand, contractor capacity and outage risk in 2027.
The export-ban counterfactual
The policy sequence matters because it moved prices. Politico reported on September 21 that a 90-day restriction was under discussion. The next day the President said, "I've said let's not send out the diesel," and Treasury Secretary Bessent said the administration was examining whether a full or partial restriction would work. ULSD futures fell 5–7% on September 22–23. On September 23 a White House official denied that a 90-day ban was planned, and Secretary Wright told an audience in New York that "the blunt tool of banning diesel exports definitely doesn't work." He later said, "We will not cease exports of US diesel, but may there be some tweak." Options reported as under discussion include wider highway use of tax-exempt dyed diesel and exempting it from biofuel-blending requirements. The WTI futures discount to Brent widened to $12.02 a barrel on September 24, the widest since May 6, a sign the market was still pricing the risk that U.S. crude would back up if product exports were curtailed.
A full ban is therefore no longer the base case, but it remains the clearest test of how constrained the system is, and every published model reaches the same conclusion.
What published models say a full U.S. diesel export ban would do
|
Source |
Storage and timing |
Refinery runs |
Prices |
|
Wood Mackenzie |
About 700,000 b/d of surplus
into storage; Gulf Coast tanks full in just over a month, the rest of the
U.S. about five weeks later |
Cuts of more than 2 million b/d
(report minimum 2.7 million) |
Northwest European diesel crack
up about 27%; gasoline risk rises |
|
S&P Global |
Up to 1.5 million b/d stranded;
pipelines could move only 100,000–200,000 b/d more from the Gulf to the East
Coast |
About 1.9 million b/d;
utilization 80–82% |
Relief concentrated on the Gulf
Coast |
|
Goldman Sachs (Sept. 28) |
Relief lasts while storage is
available |
Run cuts once storage fills |
Retail diesel down about
$0.25/gal per week at first; gasoline up about $0.30/gal per week after
storage fills; European diesel up about $3/bbl per week |
|
Rapidan Energy (via CNBC) |
Not specified |
Not specified |
Relief confined to the Gulf
Coast and lower Midwest |
Attributed model outputs and analyst views, not observed outcomes or consensus forecasts. A partial restriction cannot be modeled as half a ban: logistics, regional basis and refinery responses are nonlinear.
The logic is straightforward. A ban would strand barrels in the region with the most refining and the least local demand. Once Gulf Coast storage filled, refiners would cut crude runs, which also cuts gasoline and jet output, and the shortage would move to gasoline consumers and European diesel buyers. A voluntary restraint or licensing scheme calibrated below storage and pipeline limits could in principle lift U.S. inventories without forcing run cuts, but that is untested and depends on enforcement. Dyed-diesel relief would lower the effective price for some users without adding physical supply.
What buyers should plan for
Freight is absorbing the cost first. FreightWaves reported diesel up 10 cents a gallon in the week to September 28 while truckload spot rates rose only about 2 cents a mile, with tender rejections near 14%. Fuel surcharges lag by one to two weeks, so small carriers are financing the gap, which is a leading indicator of capacity exits and later rate increases. Farm users face peak prices at harvest. EIA's September outlook expected distillate cracks above $2 a gallon through November, averaging $1.57 for 2026 and $1.25 for 2027, with retail diesel averaging $5.07 this year and $4.40 next.
Two cautions. EIA's September outlook also expected distillate stocks to fall below 100 million barrels during September; through the latest weekly data, for September 18, they had not, and the next report is due September 30. And demand is responding at the margin: weekly product supplied has swung between 3.39 and 3.98 million barrels a day over the past five weeks, so neither demand destruction nor its absence should be read from weekly data. A Hormuz reopening and Gulf refinery restarts could compress the premium faster than EIA assumes; the bunching of 2027 turnarounds could tighten balances again next spring and autumn. Budgets should carry a high-cost base case through winter, not a single price.
Qatar's Outage Has Made U.S. LNG Central to the Atlantic Balance, and the Henry Hub Discount Is Widening, Not Closing
A transit shock with a structural core
Qatar exported only 18 LNG cargoes in the post-strike period through the end of August, against 509 in the comparable period of 2025, according to ICIS data reported by Reuters. Kpler saw no visible Qatar-linked transits of the Strait of Hormuz in August and only a handful in September; Reuters, citing Kpler and LSEG, named seven vessels exiting between September 1 and 28. On September 28 QatarEnergy extended force majeure to Italy's Edison until the beginning of December, with 35 cargoes undelivered and 23 replaced, mainly with U.S. LNG; notices to Pakistan and Bangladesh run through November.
The damage has two parts. The durable part is physical: missile strikes in March damaged Trains 4 and 6, which together represent 12.8 million tonnes a year, or about 17% of Qatar's capacity, and QatarEnergy expects them to be unavailable for three to five years. The larger part is transit: most of Qatar's liquefaction capacity is intact, and Ras Laffan is being kept ready to ramp. A Hormuz settlement could restore much of the lost supply quickly, but plant readiness does not mean inspections, shipping, insurance, feedgas and customer nominations would normalize in weeks. QatarEnergy has also said the crisis may delay its expansion, with North Field East's first train now expected in the first half of 2027 and North Field South in 2028.
Other suppliers have absorbed much of the loss. The IEA estimates that Qatar and UAE loadings fell by 35 billion cubic meters year on year from March through June, while non-Gulf exporters added about 27 bcm, offsetting about three-quarters of it. But the IEA's base case assumed Hormuz would reopen in the third quarter, which has not happened, so its annual numbers now understate the shortfall.
The United States is filling more of the gap
U.S. LNG exports averaged 17.4 billion cubic feet a day in the first half of 2026, up 23% year on year, according to EIA. Golden Pass shipped its first cargo on April 22, Corpus Christi Stage 3 was completed on August 28, and feedgas averaged about 18.0 Bcf/d in September against a record 18.8 in April. Qatar itself is replacing undelivered cargoes mainly with U.S. supply. Whether the United States is now "the" marginal global supplier depends on how that term is defined; the evidence supports a narrower and more useful claim, that U.S. flexible volumes have become increasingly central to balancing the Atlantic and global market.
Divergence, not convergence
Henry Hub averaged $2.89 per million British thermal units in September through September 22. The Dutch TTF front-month closed at €71.16 per megawatt-hour on September 25, about $24, and the Asian JKM marker was about $26 on September 28. That puts the U.S. discount near $21, against about $8.40 between Henry Hub and the IMF's European gas price in 2025; before the war, TTF averaged $12.40 in the week to January 21. The discount is the widest since 2022.
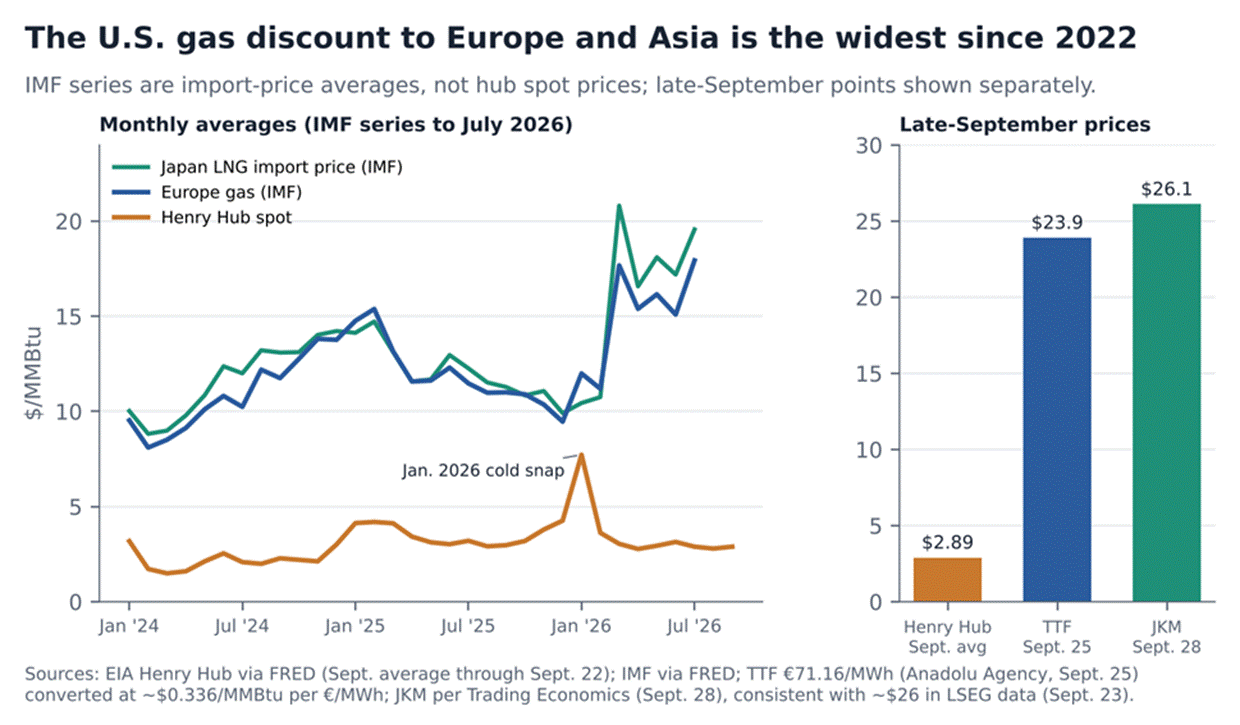
Europe and Asia are paying for the Gulf disruption; U.S. prices have barely moved. The IMF series are import-price averages and lag hub prices, which is why the late-September points are shown separately.
The reason is supply. U.S. dry gas production reached a record of about 112.9 Bcf/d in September; working gas in storage was 3,351 Bcf on September 18, 2.9% above the five-year average; and the November–October NYMEX spread fell to about 7 cents, a record low for the time of year, signaling ample near-term storage rather than export-driven tightness. Between 2021 and 2025 U.S. production rose by about 13.1 Bcf/d while LNG exports rose by about 5.3. The pinch point is regional: South Central salt storage is about 12.5% below its five-year average, which matters for Gulf Coast basis volatility in a cold snap like January's, when Henry Hub spot jumped to $4.98 in a week.
Where competitiveness is shifting now
The clearest current effect is European industrial rationalization. Argus estimates European ammonia production costs about $970 a tonne against about $175 on the U.S. Gulf Coast, with delivered imports near $675, so European producers are better off importing. Ineos is idling three acetyls units at Hull, including 480,000 tonnes a year of acetic acid, and says UK gas costs 12 times the U.S. level; that is an interested company's claim. In a German chemical-industry survey cited by C&EN, 43% of firms said they were shifting investment abroad. These closures have several causes, including weak demand, Chinese overcapacity, carbon costs and ageing assets, so gas prices accelerate decisions rather than explain them alone. In Asia, high prices are rationing demand: Wood Mackenzie forecasts Asia-Pacific LNG demand of 257 million tonnes in 2026, down from 268 million, Pakistan has rejected offers near $27, and Chinese ceramics, glass and methanol producers have cut output.
European storage remains the winter risk. EU storage was 70.87% full on September 27, according to Gas Infrastructure Europe, against more than 80% a year earlier, and Germany was near 57%, a historic low for late September. Germany's VNG says supply is secure, Norwegian pipeline flows are unaffected and the EU has eased its fill target, but a cold winter with Hormuz still constrained would leave storage very low by spring. The forward curve is already pricing relief: TTF for calendar 2027 traded just under €53 in early September, against a spot price above €70, and Allianz forecasts €36 for 2027.
The convergence question belongs to 2027–2030
The U.S. advantage could narrow if liquefaction growth outpaces production. The status of the pipeline determines how much weight that deserves.
U.S. liquefaction capacity by status (approximate peak capacity)
|
Status |
Projects |
Peak Bcf/d |
Expected in service |
|
Operating or ramping |
Pre-2024 fleet; Plaquemines
Phases 1–2; Corpus Christi Stage 3 (complete Aug. 28); Golden Pass Train 1 |
~18–20 |
In service |
|
Under construction |
Golden Pass Trains 2–3; Port
Arthur Phase 1; Rio Grande Trains 1–2 |
~4.9 |
2026–2027 |
|
Under construction |
Rio Grande Train 3; Corpus
Christi Midscale 8–9; Woodside Louisiana Phase 1 |
~3.5 |
2028–2029 |
|
Final investment decision in
2026 |
CP2 Phase 2; Commonwealth;
Delfin FLNG 1 |
~3.0 |
2029–2030 and later |
|
Proposed, not sanctioned |
Sabine Pass Stage 5 (final
environmental review issued Sept. 25); Corpus Christi Stage 4 |
~5.9 |
Not in base case |
Sources: EIA liquefaction capacity data and Today in Energy (peak capacity 18.3 Bcf/d in April 2026); company and IEA tracker disclosures; FERC. The Meridian tally. Peak capacity exceeds baseload by roughly 15–25% and is not expected feedgas demand.
On that tally, sanctioned capacity would rise from about 18 Bcf/d to about 31 Bcf/d by around 2030, close to 70% higher, if nothing slips. That is an upper bound for feedgas, not a forecast of it, and delays are common. EIA's July outlook already had Henry Hub rising to $3.57 in the fourth quarter of 2026 and $3.78 a year later, higher than in 2024 but a fraction of import-market prices. The Meridian's judgment is that U.S. gas-cost convergence is a medium-term risk, most plausible in 2027–2029 if LNG and power-burn growth together exceed annual production growth, and that a Hormuz normalization would compress TTF and JKM much faster than it would raise Henry Hub. The more likely lasting effect is a permanent step-up in European industrial energy costs relative to the United States, locking in closures that do not reverse when TTF falls.
Grid Access Is Becoming a Regional Siting Cost in PJM and Parts of ERCOT, Not a National Wall
Four constraints, four clocks
"The grid is full" conflates four different problems that move on different timelines: physical transfer capability on existing lines; generation adequacy within a market; equipment lead times; and the tariff and credit terms that decide who pays for new capacity. Each points to a different response, and each is concentrated in different places.
Four constraints on large new loads
|
Constraint |
Current indicator |
What relieves it |
Timing |
|
Transfer capability |
DOE SPARK selections: more than
23 GW of additional transfer capability across 31 projects |
Reconductoring, grid-enhancing
technologies, new lines |
SPARK mostly 2028–2031; new
lines about 10 years |
|
Generation adequacy |
PJM 2028/29 auction at the
$325/MW-day cap, 6,831 MW short; only 525 MW of new generation and uprates
cleared |
New plants, uprates, demand
flexibility, self-supply |
Multi-year |
|
Equipment |
Generator step-up transformers
above 160 weeks; high-voltage breakers about 125 weeks |
Factory expansions such as
Hitachi Energy's Mississippi plant |
New plant output from 2029 |
|
Tariffs and credit |
Large-load tariffs approved in
25 states, 7 pending; minimum-demand terms in 51 of 55 tariffs reviewed by
LBNL |
Clear rules that protect other
customers without deterring real projects |
Now, state by state |
Sources: DOE (Sept. 24, 2026); PJM (July 14, 2026); Reuters (July 9, 2026); Hitachi Energy (Sept. 15, 2026); EEI (Sept. 11, 2026); Lawrence Berkeley National Laboratory (Aug. 10, 2026). Transfer capability, generation capacity and load are not interchangeable measures.
SPARK is useful, modest and mostly late
DOE announced on September 24 its selections for the SPEED to Power program, known as SPARK: 31 projects in 26 states, $1.9 billion of federal funds plus $3.35 billion of cost share, for $5.25 billion in total. DOE says the portfolio will add more than 23 GW of transfer capability, reconductor or rebuild more than 1,500 miles of line and deploy grid-enhancing technologies across nearly 21,000 miles, serving about 100 million Americans. These are selections subject to award, not executed grants; awards are expected between October 2026 and January 2027, with performance periods of up to 48 months, so little capacity arrives before 2028.
Dividing total spending by the stated capability gives no more than about $228 per kilowatt of additional transfer capability. That is a useful sign of value, but it is not comparable with the capital cost of generation, because a kilowatt of transfer capability on one corridor is not a kilowatt of supply. The largest selections, including the Three Corners project linking SPP and the western grid in Oklahoma and about $1.2 billion through the Colorado Energy Office, are not in PJM's most constrained zones, according to Second Watt's analysis. Grid-enhancing technologies can sometimes be installed in months, as utility deployments of dynamic line rating show, so some benefits may come earlier than the award periods suggest.
PJM: a priced reserve shortfall, not a blackout forecast
PJM's auction for the 2028/29 delivery year procured 138,318 MW at the $325/MW-day cap and fell 6,831 MW short of its reliability requirement, for a reserve margin of 14.7%. PJM describes this as slimmer reserves and greater risk, not an expected inability to serve load. Only 525 MW of new generation and uprates cleared, although far more generation, about 48 GW by PJM's March count, is under construction across its footprint. PJM's independent market monitor estimates that data-center load accounted for $23.1 billion of 2025 wholesale costs, a counterfactual estimate rather than a measured bill.
Translating the clearing price into a bill is hypothetical. At $325/MW-day, a load with an 85% load factor whose peak is fully coincident with the system peak would face roughly 1.6 cents a kilowatt-hour of capacity cost in 2028/29. PJM cautions that the clearing value is not total load cost, because self-supply and bilateral hedges change what customers actually pay, and the figure has nothing to do with bills today. Current state industrial prices are also a poor guide to data-center effects: in June, industrial prices were up 14.2% year on year in Ohio and 33.8% in Delaware but down 7.0% in Maryland, single-month averages that mix rate cases, fuel riders and customer classes.
PJM's response is still a proposal. Its large-load registry, the Bring Your Own New Capacity option and an Interim Resource Adequacy Service remain pending FERC approval, and none is an operative rule; PJM expects the registry and BYONC tool from February 1, 2027. FERC's June 18 show-cause orders asked RTOs to revise or justify their interconnection rules for large loads.
Requests are not load
The most important counter-evidence to the grid-crisis narrative is attrition. ERCOT had about 410 GW of large-load requests in March, roughly 87% from data centers. Its Batch Zero process, reported to its board in mid-September, excluded 302.2 GW and set a study base of 66.4 GW. In March, ERCOT reported 9,042 MW approved to energize against an observed large-load peak of 3,883 MW. Since August 3 it has paused energization of new data-center and crypto loads of 75 MW or more; as of late August, 17 loads totaling 6,608 MW were waiting. AEP Ohio saw more than 30 GW of interest shrink to 13.0 GW of paid studies and 5.6 GW of signed contracts once its tariff required financial commitment, which the utility calls the tariff working as designed. PJM has cut its near-term peak forecasts, including 3,735 MW for 2027.
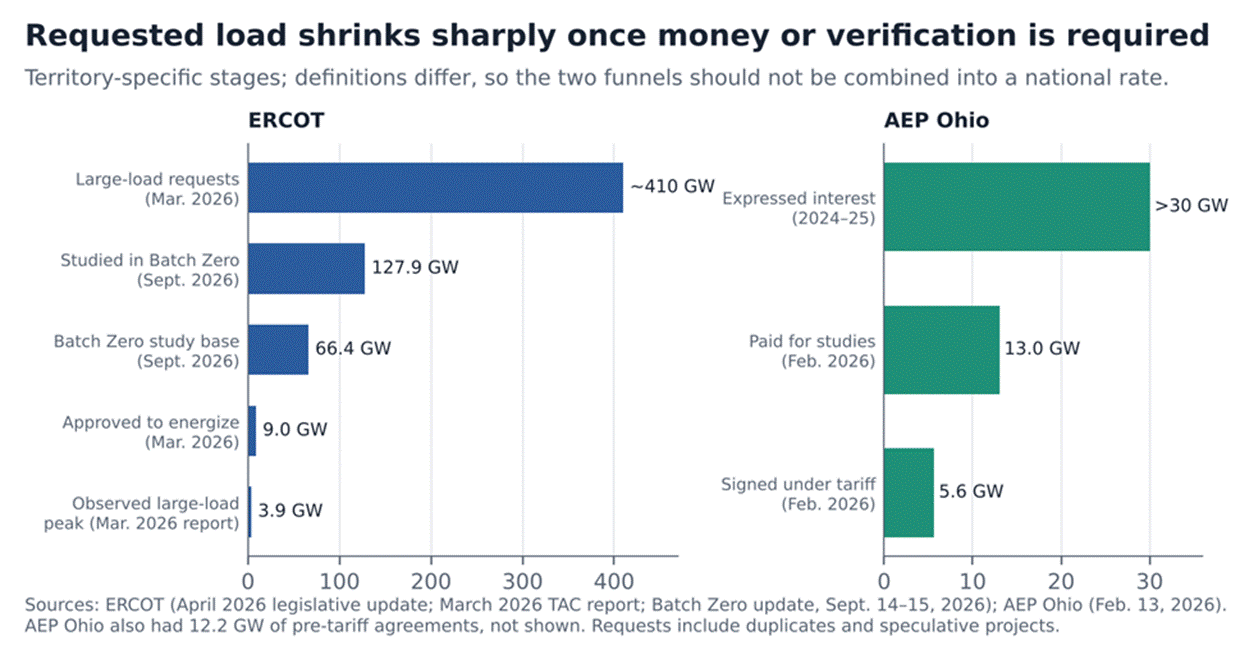
Most requested load disappears at the first step that requires money or verification. Stage definitions differ, so these funnels cannot be combined into a national attrition rate.
The constraint is therefore less "not enough wires nationally" than too many speculative requests competing for scarce deliverable capacity in specific zones. That makes contract terms the variable to watch. LBNL found minimum-demand charges in 51 of 55 large-load tariffs and collateral requirements in 43; such terms protect existing customers from stranded costs as well as raising project costs. Virginia's new GS-5 class for Dominion customers of 25 MW or more, from January 1, 2027, sets minimum payments of 85% for transmission and distribution and 60% for generation over 14-year contracts. In a case that illustrates how thin some commitments have been, a FERC decision on September 22, as reported by mGrid, sent a dispute over a 1.8 GW, $20 billion data-center connection to ComEd in Illinois, backed by a $1 letter of credit, back to court.
What it means for industrial siting
Manufacturers compete in the same large-load queues as data centers, because thresholds of 50–75 MW apply by size, not use. Minimum-demand and collateral terms fall hardest on loads with uncertain ramp profiles, which favors hyperscalers with deep balance sheets over mid-size manufacturers, and self-supply requirements, if approved, would add capital and fuel-procurement obligations. The reliability side is real too: on July 22 about 3,800 MW of Northern Virginia data-center load tripped offline after a cleared 230 kV fault, which PJM said happened too early. For site selection, the screen is now deliverable capacity at a specific node, the utility's tariff and collateral terms, and the realistic energization date, alongside the price per kilowatt-hour. Lower prices in non-PJM states do not by themselves prove a better location once connection time, reliability and incentives are counted.
OIL & REFINED PRODUCTS
Global balance. The IEA's September report (September 11) projected 2026 global oil supply down 5.7 million barrels a day and demand down 2.5 million, with stocks drawing 3.1 million barrels a day in August and global refinery runs down 2.6 million for the year. EIA's September outlook had Brent near $90 in the second half of 2026 and $74 in 2027, assuming Hormuz normalizes and Middle East output stays below pre-conflict levels until the second quarter of 2027.
Export restrictions abroad. Russia's ban on diesel exports by producers is due to expire on September 30; whether it is extended is the next signal. S&P Global expects Chinese product exports to fall about 31% in October, with Chinese gasoil stocks the lowest since 2023, while India's product exports were down 40% year on year in August. Asian supply that offset Western shortfalls earlier in the year is shrinking.
Other products. Northwest European jet margins near $106 a barrel and ARA jet stocks 55% below a year earlier point to a winter test for airlines; Energy Aspects estimates a third-quarter fuel-oil deficit of 218,000 barrels a day for shipping. Wide cracks are not the same as refinery profit: feedstock basis, yields, operating costs and hedging all intervene.
Next data. EIA's next weekly report, due September 30, will show whether distillate stocks held above 100 million barrels and whether exports stayed above 1.3 million barrels a day.
NATURAL GAS & LNG
Covered in depth in the second editorial. Additional points: FERC staff issued the final environmental impact statement for Sabine Pass Stage 5 on September 25, a regulatory step for a proposed expansion of about 2.6 Bcf/d that has not been sanctioned; EIA's September outlook expects U.S. working gas of 3,969 Bcf at the end of October, 5% above the five-year average; and LNG charter rates for winter cover have risen to about $40,000 a day, with cross-basin voyages costing roughly twice intra-basin ones, adding to the Asia–Atlantic spread. Physical liquefaction capacity and shipping availability are separate constraints, and Qatar's restart depends on the second.
COAL
Structural decline at home. EIA's September outlook forecasts U.S. power-sector coal consumption falling 8% in 2026, to 417 million short tons, and 6% in 2027, to 392 million, with coal's share of generation slipping from 17% in 2025 to 16% this year and 14% next.
Security-driven retention. DOE has again used its emergency authority under Section 202(c) of the Federal Power Act to keep TransAlta's Centralia Unit 2 in Washington state available for another 90 days, in Order No. 202-26-44 announced in mid-September. Orders of this kind delay retirements without changing the long-run economics.
Temporary switching abroad. The IEA notes that high LNG prices have caused some gas-to-coal switching internationally this year, and European coal prices have risen with power forwards: Vattenfall reports API2 coal moving from about $112 to $132 a tonne as German 2027 baseload power rose from about €95 to €120 per megawatt-hour. This is a fuel-security response to LNG scarcity, not a reversal of coal's structural decline in Europe or the United States.
NUCLEAR
Duane Arnold restart financing. On September 8 DOE closed a loan of up to $1.9 billion to NextEra Energy to restart the 615 MW Duane Arnold plant in Iowa, through its Office of Energy Dominance Financing. DOE says the project will support nearly 1,500 construction jobs and more than 450 operating jobs. Restart still requires NRC licensing approvals, and no restart date has been confirmed. It is the most commercially significant nuclear development of the month: a restart adds firm capacity in years rather than the decade a new large plant takes.
Advanced reactors. DOE reported in July that four advanced reactor designs under its pilot program, including Aalo Atomics' Aalo-X at Idaho National Laboratory, had achieved criticality by July 4. These were zero-power criticality demonstrations, a technology milestone that does not indicate near-term commercial generation.
RENEWABLES
EIA's September outlook expects solar's share of U.S. generation to rise from 7% in 2025 to 8% in 2026 and 9% in 2027, with solar generation growing 21% this year and 18% next; wind's share holds at 11% this year before rising to 12% in 2027. Total generation is forecast to grow 2.2% to a record 4,368 billion kilowatt-hours in 2026. In PJM, solar accounts for 27.6 GW of the roughly 48 GW of generation under construction, alongside 8.1 GW of wind and 3.9 GW of storage, and PJM attributes delays mainly to permitting (29%) and supply chains (23%). Generation forecasts are not a substitute for project and policy intelligence: The Meridian did not complete a review of late-September federal renewables policy or capacity additions for this edition.
POWER & ELECTRICITY MARKETS
Covered in depth in the third editorial. EIA expects record U.S. generation in 2026 and 2027, with the fastest growth in Texas. PJM's capacity scarcity is a regional condition, not a national price signal, and today's retail bills reflect existing capacity charges, fuel adjustments, transmission and rate cases, not the 2028/29 auction. ERCOT's ride-through requirements for large loads took effect on August 1, and PJM has scheduled a backstop procurement window from September 30 to October 21 with a cap of $555/MW-day, under its July board plan. The 2029/30 base residual auction date and the FERC status of PJM's interim service filing should be checked as they develop.
ENERGY INFRASTRUCTURE & CAPACITY
Transformers. Hitachi Energy announced on September 15 a $528 million power-transformer factory in Gallman, Mississippi, its largest U.S. investment, which it says will more than double the capacity of its nearby Crystal Springs plant and create more than 700 jobs. Production starts in 2029, so it addresses the lead-time problem (generator step-up transformers above 160 weeks, high-voltage breakers about 125 weeks) with a multi-year lag.
Grid and LNG compete for the same inputs. SPARK's reconductoring, new gas-fired generation, data-center substations and Gulf Coast liquefaction trains all draw on transformers, switchgear, skilled electrical labor and heavy-haul logistics. Expect equipment allocation, not just financing, to set project schedules into 2028.
Refining. About 550,000 barrels a day of U.S. capacity has closed since 2025, and global closures since 2019 total about 9.7 million barrels a day by Industrial Info Resources' count. No new U.S. refinery is in prospect, so maintenance timing is the main lever on supply.
CROSS-LAYER ENERGY IMPLICATIONS
Freight. Diesel is the second-largest cost for trucking, and carriers are absorbing increases faster than rates adjust. Surcharge lag and thin small-carrier margins point to capacity exits and firmer rates if diesel stays above $6.
Chemicals and fertilizers. Wide gas spreads reinforce the U.S. feedstock advantage in ammonia, methanol and ethane-based chemicals, and Tampa ammonia fell to $555 a tonne in September from $825 in May as U.S. product prices decoupled from European costs. Sulfur above $1,000 a tonne, a refinery by-product, is raising phosphate costs. European closures should not be attributed to gas alone.
Commodities and manufacturing. Reconductoring and new lines raise demand for aluminum and composite conductors, copper, transformers and grain-oriented electrical steel, all already supply-constrained.
Trade policy. With Europe taking about half of U.S. diesel exports, by Wood Mackenzie's estimate, any U.S. restriction would be a transatlantic event. Refinery maintenance deferred into 2027 creates a second-round product risk after today's policy responses fade.
Meridian Outlook
Base case (fourth quarter 2026 through the second half of 2027, moderate confidence). Through the winter, global diesel and LNG markets remain tighter and more volatile than U.S. crude and Henry Hub balances. Policy tweaks may moderate what some users pay for diesel but do not rebuild inventories or add refining capacity, and a full U.S. export ban does not happen. U.S. gas keeps a large cost advantage over Europe and Asia. Grid-access constraints stay regional, with PJM and parts of ERCOT imposing the greatest connection, collateral and self-supply friction.
Principal evidence. Distillate stocks below the five-year floor despite record output; Russian and Chinese export constraints; damaged Qatari capacity and continuing force majeure; below-normal European storage; growing U.S. LNG exports against record U.S. production and above-average storage; PJM's reserve shortfall; SPARK's deployment lag.
Contrary case. A rapid Hormuz normalization, successful refinery repairs and weaker freight and industrial demand compress diesel and LNG prices faster than expected; continued U.S. production growth and large-load attrition prevent meaningful Henry Hub or grid-cost escalation.
What would strengthen it. Distillate stocks approaching 100 million barrels; Russian and Chinese restrictions extended beyond October; Qatari force majeure running into 2027; EU storage entering withdrawals below target; U.S. feedgas above its April record; signed large-load commitments staying high after collateral requirements.
What would weaken it. Rapid inventory builds; Gulf and Russian refinery restarts; sustained normalization of Qatari cargoes; U.S. production materially outpacing LNG and power demand; SPARK projects disclosing earlier in-service dates in constrained zones; continued collapse of large-load requests on verification.
Invalidators. Durable normalization of Hormuz traffic and Gulf refining before winter; U.S. distillate stocks back within the seasonal range; TTF falling close to delivered U.S. LNG economics without a corresponding Henry Hub increase; PJM resolving its reserve shortfall while connection times and tariffs stabilize.
Calls to audit. The Meridian will hold itself to these judgments:
• U.S. distillate stocks will remain below their 2021–25 seasonal minimum in EIA weekly data through the end of November 2026. Moderate confidence.
• The United States will not impose a full ban on diesel exports before December 31, 2026; narrower measures remain possible. Moderate confidence.
• The gap between TTF and Henry Hub will stay wider than its 2025 average of roughly $8 per million Btu through March 2027. Moderate confidence; a Hormuz settlement is the main risk.
Decision calendar
|
Date |
Event |
Status |
|
Sept. 30 |
EIA weekly petroleum data for
the week ending Sept. 25 |
Scheduled |
|
Sept. 30 |
Russia's producer diesel-export
ban expires unless extended |
Scheduled |
|
Sept. 30–Oct. 21 |
PJM backstop procurement window
(cap $555/MW-day) |
Scheduled under PJM's July plan |
|
Oct. 2026–Jan. 2027 |
SPARK awards executed |
Expected |
|
November |
Qatari force majeure to Pakistan
and Bangladesh runs through the month |
Announced |
|
Early December |
Qatari force majeure to Edison
ends unless extended |
Announced |
|
Mid-December |
DOE order keeping Centralia Unit
2 available lapses unless renewed |
Scheduled |
|
Jan. 1, 2027 |
Dominion GS-5 large-load rate
class takes effect |
Scheduled |
|
Feb. 1, 2027 |
PJM large-load registry and
BYONC tool expected |
Pending FERC approval |
|
1H 2027 |
North Field East first train |
Company guidance |
|
2027 |
Golden Pass Train 3, Port Arthur
Phase 1, Rio Grande Trains 1–2 |
Under construction |
|
2029 |
Hitachi Energy Mississippi
transformer plant begins production |
Announced |
Sources: as cited in this edition.
Signals to Watch
• Weekly U.S. distillate stocks against 100 million barrels, exports against 1.3 million barrels a day, refinery utilization, and East Coast and Midwest stocks.
• Any formal export restriction, licensing scheme or voluntary restraint, and any federal action on dyed-diesel use or biofuel-blending exemptions.
• The expiry or extension of Russia's diesel-export ban after September 30 and China's October export allocations.
• ULSD cracks relative to gasoline cracks and Brent, and the WTI–Brent spread as a gauge of export-restriction risk.
• Qatar-linked Hormuz transit counts, force-majeure notices and Ras Laffan loadings.
• EU, German and Dutch storage trajectories and the first sustained withdrawals.
• U.S. production, South Central salt storage and LNG feedgas against April's 18.8 Bcf/d record; Golden Pass Train 2 start-up.
• PJM backstop-procurement results after October 21, the 2029/30 auction schedule and FERC action on PJM's large-load filings.
• ERCOT Batch Zero final classifications and the end of the energization pause.
• SPARK award execution, project-level megawatts and in-service dates.
• Transformer, breaker and conductor lead times.
• European ammonia, methanol and acetyls operating rates, not company announcements alone.
Sources
• U.S. Energy Information Administration — Weekly Petroleum Status Report, Tables 1 and 4 (week ending Sept. 18, 2026), September 23, 2026. https://www.eia.gov/petroleum/supply/weekly/
• U.S. Energy Information Administration — Weekly distillate supply estimates and stocks by PADD, through September 18, 2026. https://www.eia.gov/dnav/pet/pet_sum_sndw_dcus_nus_w.htm
• U.S. Energy Information Administration — Short-Term Energy Outlook, September 2026, September 9, 2026. https://www.eia.gov/outlooks/steo/
• U.S. Energy Information Administration — STEO: Electricity, coal and renewables, September 9, 2026. https://www.eia.gov/outlooks/steo/report/elec_coal_renew.php
• U.S. Energy Information Administration — Press release 592 (September 2026 Short-Term Energy Outlook), September 9, 2026. https://www.eia.gov/pressroom/releases/press592.php
• U.S. Energy Information Administration — Today in Energy #68104 (distillate inventories and crack spreads), September 2026. https://www.eia.gov/todayinenergy/detail.php?id=68104
• U.S. Energy Information Administration — Today in Energy #67184 (distillate exports to Europe), 2026. https://www.eia.gov/todayinenergy/detail.php?id=67184
• Federal Reserve Bank of St. Louis (EIA data) — Spot prices: Brent, WTI, NY Harbor and Gulf Coast ULSD, NY Harbor gasoline, Gulf Coast jet fuel, Henry Hub, through September 22, 2026. https://fred.stlouisfed.org/series/DDFUELNYH
• Federal Reserve Bank of St. Louis (IMF data) — Global price of natural gas, EU; Global price of LNG, Asia, through July 2026. https://fred.stlouisfed.org/series/PNGASEUUSDM
• Kansas State University (AgManager) — Diesel prices article, September 14, 2026. https://www.agmanager.info/sites/default/files/pdf/article%20-%20diesel%20prices%209-14-26.pdf
• Reuters (Ron Bousso) — Trump's diesel export dilemma: good politics, bad economics, September 23, 2026. https://www.reuters.com/commentary/reuters-open-interest/trumps-diesel-export-dilemma-good-politics-bad-economics-bousso-2026-09-23/
• Euronext (Reuters) — Oil holds near two-week lows while diesel cracks hit record, September 23, 2026. https://live.euronext.com/en/financial-news/oil-holds-near-two-week-lows-while-diesel-cracks-hit-record
• S&P Global Commodity Insights (via Hellenic Shipping News) — Diesel export ban would send shockwaves through US refining system, September 2026. https://www.hellenicshippingnews.com/diesel-export-ban-would-send-shockwaves-through-us-refining-system/
• S&P Global Commodity Insights — Jet fuel and middle distillates market coverage, September 2026. https://www.spglobal.com/energy/en/commodity/oil/refined-products/jet-fuel
• ICIS — Europe jet fuel strength faces winter test as stocks fall, September 18, 2026. https://www.icis.com/explore/resources/news/2026/09/18/11233979/europe-jet-fuel-strength-faces-winter-test-as-stocks-fall-demand-clouds-gather/
• Wood Mackenzie — A US diesel export ban would trigger global stock drawdowns, cut US refinery utilisation and risk driving gasoline prices higher, September 2026. https://www.woodmac.com/press-releases/a-us-diesel-export-ban-would-trigger-global-stock-drawdowns-cut-us-refinery-utilisation-and-risk-driving-gasoline-prices-higher/
• Wood Mackenzie — Refining and oil products: US diesel export ban (report abstract), September 2026. https://www.woodmac.com/reports/refining-and-oil-products-us-diesel-export-ban-150506792
• Reuters — Goldman expects initial diesel price decline under US export curbs, September 28, 2026. https://www.reuters.com/business/energy/goldman-expects-initial-diesel-price-decline-under-us-export-curbs-2026-09-28/
• Reuters — Talk of US export ban on diesel deepens US crude futures discount to global benchmark, September 25, 2026. https://www.reuters.com/business/energy/talk-us-export-ban-diesel-deepens-us-crude-futures-discount-global-benchmark-2026-09-25/
• CNBC — Trump diesel export ban and gas prices, September 23, 2026. https://www.cnbc.com/2026/09/23/trump-diesel-export-ban-gas-prices.html
• Politico — Big Ag, Big Oil and the diesel export ban, September 21, 2026. https://www.politico.com/news/2026/09/21/big-ag-big-oil-diesel-export-ban-01086191
• OilPrice.com — White House rules out diesel export ban as prices surge above $6.50, September 23, 2026. https://oilprice.com/Energy/Energy-General/White-House-Rules-Out-Diesel-Export-Ban-as-Prices-Surge-Above-650.html
• OilPrice.com — US Energy Secretary: Blunt Tool of Banning Diesel Exports Doesn't Work, September 23, 2026. https://oilprice.com/Energy/Energy-General/US-Energy-Secretary-Blunt-Tool-of-Banning-Diesel-Exports-Doesnt-Work.amp.html
• The Edge Malaysia — Report on U.S. diesel export policy and Secretary Wright's remarks, September 26, 2026. https://theedgemalaysia.com/node/819464
• Reuters — US Energy Secretary Wright says diesel export ban would not work, September 23, 2026. https://www.reuters.com/legal/litigation/us-energy-secretary-wright-says-diesel-export-ban-would-not-work-2026-09-23/
• Reuters — Iran, Ukraine wars deliver worst-hit years for oil refining output, May 13, 2026. https://www.reuters.com/business/energy/iran-ukraine-wars-deliver-worst-hit-years-oil-refining-output-2026-05-13/
• Reuters — Half of Russia's top diesel-producing refineries cut output after drone strikes, September 15, 2026. https://www.reuters.com/business/energy/half-russias-top-diesel-producing-refineries-cut-back-output-after-drone-strikes-2026-09-15/
• Reuters (IEA Oil Market Report) — Global 2026 oil supply gap to deepen on delayed return of normal Gulf flows – IEA, September 11, 2026. https://www.reuters.com/business/energy/global-2026-oil-supply-gap-deepen-delayed-return-normal-gulf-flows-iea-says-2026-09-11/
• Industrial Info Resources — Some US refiners deferring maintenance from 2026 to 2027, September 2026. https://www.industrialinfo.com/iirenergy/industry-news/article/some-us-refiners-deferring-maintenance-from-2026-to-2027--362613
• Reuters — Ship fuel shortage looms as refiners strained by war favour other products, September 7, 2026. https://www.reuters.com/business/energy/ship-fuel-shortage-looms-refiners-strained-by-war-favour-other-products-2026-09-07/
• FreightWaves — Diesel up 10 cents, spot rates up 2 cents: margin squeeze, September 28, 2026. https://www.freightwaves.com/news/diesel-up-10-cents-spot-rates-up-2-margin-squeeze
• Reuters — Qatar extends force majeure notices on LNG supply to Edison, some Asian clients, September 28, 2026. https://www.reuters.com/business/energy/qatar-will-not-deliver-gas-european-client-edison-until-beginning-december-2026-09-28/
• Edison S.p.A. — QatarEnergy extends force majeure until the beginning of December 2026, September 28, 2026. https://www.edison.it/en/edison-qatarenergy-extends-force-majeure-until-beginning-december-2026
• The National — Qatar extends LNG force majeure as Hormuz disruption threatens winter supply, September 28, 2026. https://www.thenationalnews.com/business/energy/2026/09/28/qatar-extends-lng-force-majeure-as-hormuz-disruption-threatens-winter-supply/
• Reuters (Kpler, LSEG data) — Qatar-linked LNG traffic through Hormuz strait picks up despite conflict, September 28, 2026. https://www.reuters.com/business/energy/qatar-linked-lng-traffic-through-hormuz-strait-picks-up-despite-conflict-2026-09-28/
• QatarEnergy — Missile attacks reduced Qatar's LNG export capacity by 17%, March 19, 2026. https://www.qatarenergy.qa/en/MediaCenter/Pages/newsdetails.aspx?ItemId=3897
• Reuters — QatarEnergy says Hormuz crisis may delay LNG expansion projects, September 21, 2026. https://www.reuters.com/business/energy/qatarenergy-says-hormuz-crisis-may-delay-lng-expansion-projects-2026-09-21/
• International Energy Agency — Gas Market Report, Q3-2026 – Executive summary, August 12, 2026. https://www.iea.org/reports/gas-market-report-q3-2026/executive-summary
• U.S. Energy Information Administration — Today in Energy: US LNG exports rise 23% in 1H26, September 2, 2026. https://www.eia.gov/todayinenergy/detail.php?id=68064
• U.S. Energy Information Administration — Today in Energy: Corpus Christi LNG expansion makes facility second-largest in US, September 15, 2026. https://www.eia.gov/todayinenergy/detail.php?id=68144
• U.S. Energy Information Administration — Today in Energy: Golden Pass ships first cargo, April 23, 2026. https://www.eia.gov/todayinenergy/detail.php?id=67564
• U.S. Energy Information Administration — Today in Energy: LNG export capacity additions (peak capacity 18.3 Bcf/d), April 16, 2026. https://www.eia.gov/todayinenergy/detail.php?id=67484
• U.S. Energy Information Administration — Short-Term Energy Outlook, July 2026 (natural gas), July 7, 2026. https://www.eia.gov/outlooks/steo/
• IndexBox (reporting EIA Weekly Natural Gas Storage Report) — EIA natural gas storage rises 53 Bcf for week ending September 18, 2026, September 24, 2026. https://www.indexbox.io/blog/eia-natural-gas-storage-rises-53-bcf-for-week-ending-september-18-2026/
• U.S. Energy Information Administration — Natural Gas Weekly Update (pre-war benchmark prices), January 22, 2026. https://www.eia.gov/naturalgas/weekly/
• BOE Report (Reuters/LSEG data) — US natgas prices hit 11-week high on cooler weather, lower output, September 23, 2026. https://boereport.com/2026/09/23/us-natgas-prices-hit-11-week-high-on-cooler-weather-lower-output/
• Pipeline & Gas Journal (Reuters/LSEG data) — US natgas prices fall 3.5% on lower demand forecasts ahead, September 25, 2026. https://pgjonline.com/news/2026/september/us-natgas-prices-fall-35-on-lower-demand-forecasts-ahead
• Anadolu Agency — European gas prices fall 10.5% on week as supply concerns ease, September 25, 2026. https://www.aa.com.tr/en/energy/natural-gas/european-gas-prices-fall-105-on-week-as-supply-concerns-ease/59872
• Trading Economics — LNG Japan Korea Marker price, September 28, 2026. https://tradingeconomics.com/commodity/liquefied-natural-gas-japan-korea
• Gas Infrastructure Europe (AGSI+) — EU gas storage, September 27, 2026, September 27, 2026. https://agsi.gie.eu/
• Reuters — German gas supply is secure despite low storage levels, VNG chief says, September 28, 2026. https://www.reuters.com/business/energy/german-gas-supply-is-secure-despite-low-storage-levels-vng-chief-says-2026-09-28/
• Euronews — Does the EU have enough gas for winter?, September 28, 2026. https://www.euronews.com/2026/09/28/euronews-explains-does-the-eu-have-enough-gas-for-winter
• Vattenfall Energy Sales — Market outlook September 2026, September 2026. https://energysales.vattenfall.de/en/publications/articles/market-outlook-september-2026
• Allianz Research — Energy update, September 16, 2026. https://www.allianz.com/content/dam/onemarketing/azcom/Allianz_com/economic-research/publications/specials/en/2026/september/2026_09_16_Energy_update.pdf
• Argus Media — Europe's ammonia market hit by rising gas prices, September 29, 2026. https://www.argusmedia.com/en/news-and-insights/market-opinion-and-analysis-blog/europe-ammonia-market-rising-gas-prices
• Gidex — Tampa ammonia benchmark falls to $555/t in September, September 11, 2026. https://gidex.com/news/tampa-ammonia-benchmark-falls-to-555-t-in-september-fourth-monthly-dro/
• C&EN (American Chemical Society) — Ineos to shutter UK acetyls plants, September 24, 2026. https://cen.acs.org/business/economy/ineos-shutter-uk-acetyls-plants/104/web/2026/09
• Reuters — Asian LNG demand set to fall for second year as war shrinks supply, September 17, 2026. https://www.reuters.com/business/energy/asian-lng-demand-set-fall-second-year-war-shrinks-supply-2026-09-17/
• Wood Mackenzie — Asian LNG demand decline for second consecutive year, July 13, 2026. https://www.woodmac.com/press-releases/asian-lng-demand-decline-for-second-consecutive-year/
• Affinity Shipping — LNG Weekly Reports, July–September 2026. https://www.affinityship.com/reports?_category=lng-weekly-report
• S&P Global Commodity Insights — Delfin reaches FID on first US floating LNG export project, June 25, 2026. https://www.spglobal.com/energy/en/news-research/latest-news/electric-power/060326-delfin-reaches-final-investment-decision-on-us-first-floating-lng-export-project
• International Energy Agency — Global LNG Capacity Tracker, August 12, 2026. https://www.iea.org/data-and-statistics/data-tools/global-lng-capacity-tracker
• Targeted News Service (FERC) — FERC staff issues Final EIS for Sabine Pass Stage 5 Expansion (CP24-75-001 et al.), September 25, 2026. https://targetednews.com/pr_display.php?pr_id=9758833
• U.S. Department of Energy — Energy Department announces SPEED to Power investments across 26 states, September 24, 2026. https://www.energy.gov/articles/energy-department-announces-speed-power-investments-across-26-states-lower-electricity
• U.S. Department of Energy — SPARK funding opportunity (DE-FOA-0003580), February 25, 2026. https://www.energy.gov/oe/speed-power-through-accelerated-reconductoring-and-other-key-advanced-transmission-technology
• Second Watt — DOE SPARK reconductoring selections: what 23 GW means for data-center power, September 24, 2026. https://secondwatt.com/resources/doe-spark-reconductoring-selections-data-center-power
• PJM Interconnection — PJM capacity auction procures 138,318 MW of generation resources (2028/2029 BRA), July 14, 2026. https://www.pjm.com/-/media/DotCom/about-pjm/newsroom/2026-releases/20260714-pjm-capacity-auction-procures-138318-mw-of-generation-resources.pdf
• PJM Inside Lines — PJM Board directs action on resource adequacy, affordability and large loads, July 27, 2026. https://insidelines.pjm.com/pjm-board-directs-action-on-resource-adequacy-affordability-and-large-loads/
• PJM Interconnection — Large Load (registry, BYONC and Interim Resource Adequacy Service status), accessed September 2026. https://www.pjm.com/markets-and-operations/large-load
• PJM Inside Lines — PJM updated 20-year load forecast, January 14, 2026. https://insidelines.pjm.com/pjms-updated-20-year-forecast-continues-to-see-significant-long-term-load-growth/
• PJM Interconnection — Presentation to the Ohio Senate Energy Committee, March 24, 2026. https://search-prod.lis.state.oh.us/api/v2/general_assembly_136/committees/cmte_s_energy_1/meetings/cmte_s_energy_1_2026-03-24-1000_1211/submissions/pjmohiosenateenergycommittee.pdf
• Utility Dive (Monitoring Analytics) — PJM capacity, energy market reliability: market monitor, March 13, 2026. https://www.utilitydive.com/news/pjm-capacity-energy-market-reliability-monitoring-analytics/814647/
• White & Case — FERC orders grid operators to promptly revise or justify interconnection rules for data centers, June 25, 2026. https://www.whitecase.com/insight-alert/ferc-orders-grid-operators-promptly-revise-or-justify-interconnection-rules-data
• ERCOT — Large Load Update – April 2026 legislative hearing, April 1, 2026. https://www.ercot.com/services/rq/large-load-integration
• ERCOT — March TAC Report – Large Load Integration status, March 13, 2026. https://www.ercot.com/files/docs/2026/03/12/March-TAC-Report.pdf
• ERCOT — Batch Zero Update (Board item 14), September 14–15, 2026. https://www.ercot.com/files/docs/2026/09/11/14-Batch-Zero-Update.pdf
• ERCOT — Batch Zero verification and audit (PUCT presentation), August 20, 2026. https://www.ercot.com/files/docs/2026/08/20/Batch-Zero-Verification-and-Audit-PUCT-Presentation.pdf
• AEP Ohio — Data Center Tariff working as designed, February 13, 2026. https://www.aepohio.com/company/news/view?releaseID=10753
• Lawrence Berkeley National Laboratory — Electricity rate designs for large loads, August 10, 2026. https://emp.lbl.gov/publications/electricity-rate-designs-large-0
• Edison Electric Institute — List of large customer projects and tariffs, September 11, 2026. https://www.eei.org/-/media/Project/EEI/Documents/Issues%20and%20Policy/List%20of%20Large%20Customer%20Projects%20and%20Tariffs
• Virginia General Assembly (DLAS) — Report referencing Dominion GS-5 rate class, 2026. https://apps.dlas.virginia.gov/User_db/frmView.aspx?ViewId=7037&s=7
• mGrid — FERC sends a $20 billion data-center fight back to court over a $1 letter of credit, September 22, 2026. https://mgrid.org/2026/09/22/ferc-sends-a-20-billion-data-center-fight-back-to-court-over-a-1-letter-of-credit/
• mGrid (citing PJM Operating Committee) — PJM says Northern Virginia data centers tripped too early when 3,800 MW left the grid, August 11, 2026. https://mgrid.org/2026/08/11/pjm-says-northern-virginia-data-centers-tripped-too-early-when-3800-mw-left-the-grid-after-a-cleared-fault/
• U.S. Energy Information Administration — Electric Power Monthly, Table 5.6.A (June 2026), August 26, 2026. https://www.eia.gov/electricity/monthly/epm_table_grapher.php?t=epmt_5_6_a
• Energy Systems Integration Group — Grid-Enhancing Technologies report, October 2025. https://www.esig.energy/wp-content/uploads/2025/10/ESIG-Grid-Enhancing-Technologies-report-2025.pdf
• U.S. Department of Energy — Transmission Interconnection and Impact Assessment, October 2024. https://www.energy.gov/sites/default/files/2024-10/DOE_OP_2024_Report-Transmission_Impact_Assessment.pdf
• Reuters — US power companies scramble to secure equipment as data-center demand strains supply, July 9, 2026. https://www.reuters.com/business/energy/us-power-companies-scramble-secure-equipment-surging-data-center-demand-strains-2026-07-09/
• Hitachi Energy — Hitachi deepens commitment to U.S. manufacturing with $528 million Mississippi transformer factory, September 15, 2026. https://www.hitachienergy.com/ca/fr/news-and-events/press-releases/2026/09/hitachi-deepens-commitment-to-u-s-manufacturing-with-528-million-mississippi-transformer-factory
• U.S. Department of Energy — Energy Department closes $1.9 billion loan to restart Duane Arnold nuclear plant, September 8, 2026. https://www.energy.gov/articles/energy-department-closes-19-billion-loan-restart-duane-arnold-nuclear-plant
• U.S. Department of Energy — Department of Energy celebrates fourth criticality ahead of July 4th goal, July 6, 2026. https://www.energy.gov/articles/department-energy-celebrates-fourth-criticality-ahead-july-4th-goal
• U.S. Department of Energy — Federal Power Act Section 202(c): TransAlta Order No. 202-26-44 (Centralia Unit 2), September 2026. https://www.energy.gov/ceser/federal-power-act-section-202c-transalta-order-no-202-26-44