
Freight Capacity Is Returning at Sea and Tightening on Land
Trans-Pacific spot rates have leveled off without a confirmed downturn, supported by record September imports and by port congestion that still absorbs about 11% of the world container fleet. For U.S. shippers, the tighter constraint now sits inland...

Trans-Pacific spot rates have leveled off without a confirmed downturn, supported by record September imports and by port congestion that still absorbs about 11% of the world container fleet. For U.S. shippers, the tighter constraint now sits inland: rail-bound containers are aging at Los Angeles, and truckload carriers are refusing about one contracted load in seven even as freight volumes fall. Airfreight buyers, meanwhile, are shortening their commitments.
Executive Takeaway
Capacity is loosening at sea and tightening on land, and for U.S. importers the binding constraint now sits inland. Trans-Pacific spot rates have stopped rising but have not turned down in a confirmed way: Xeneta put Far East–U.S. West Coast at $8,336 per 40-foot container and the East Coast at $11,512 on October 7, effectively unchanged from October 1, and only Drewry's index shows declines on both coasts. Vessel capacity is returning as port congestion eases and new ships deliver, but demand has not stepped aside, with U.S. containerized imports at a record 2.55 million TEU in September, up 10.3% from a year earlier. Ashore, the direction reverses: rail-bound import boxes at Los Angeles are aging, and truckload carriers are rejecting about one contracted load in seven although accepted volumes are about 20% below their June peak.
The principal commercial consequence is that a lower ocean rate will not, by itself, lower landed cost. On October 6, 31.9% of the import containers waiting for on-dock rail at Los Angeles had waited nine days or more, up from 23.6% a week earlier, and longer waits can add demurrage, per-diem and inventory-carrying cost. The East Coast premium, $3,176 per container on Xeneta's measure, is a port-to-port figure, not a door-to-door saving. In trucking, shippers' costs rose this summer through contract rates and fuel more than through spot linehaul, and contract-pricing pressure is the highest since 2022. With diesel now 5.1% below its September record, all-in truck costs should ease, but that relief may disguise ex-fuel contract pricing that stays firm into 2027 bids.
The most consequential near-term risk is the November 10 expiry of the suspension of U.S. port fees on Chinese-operated and Chinese-built ships. If the suspension lapses unchanged, the published schedules point to $80 per net ton for Chinese operators and, for other operators of Chinese-built ships, the higher of $23 per net ton or $153 per container. The extension of the wider U.S.–China trade truce to January 10 does not by itself extend the fee suspension, and no notice extending it had been identified as of October 9. The deadline could prompt surcharge filings, fleet substitution or renewed front-loading at a time when rates might otherwise ease. The clearest opportunity is in Asia–Europe, where rates are 34–43% below July levels as more services return through Suez and demand eases.
The Meridian's base case, held with MODERATE CONFIDENCE, is a gradual trans-Pacific decline from elevated levels, with all-in truckload rates tracking diesel while ex-fuel contract pricing stays firm. That view would weaken if filed rate increases are realized or front-loading resumes ahead of the fee deadline; a major new Red Sea or Hormuz disruption that diverts tonnage would invalidate it. With ocean, truck and air markets moving in different directions, no single procurement posture fits all three. Air buyers are already adjusting: in Xeneta's data, 60% of new airfreight contracts signed in the third quarter ran three months or less, against 25% a year earlier, although that rests on one provider and one quarter, and a quarter of new contracts are still annual.
Trans-Pacific Rates Have Plateaued as the U.S. Constraint Moves Inland
A plateau, not yet a correction
Xeneta's market-average spot rate from the Far East to the U.S. West Coast was $8,336 per FEU on October 7 and to the East Coast $11,512, against $8,346 and $11,523 on October 1, a slip of about 0.1% on both lanes (The Meridian calculation). Xeneta's own October 8 release reports increases of 1.1% and 0.5% because it measures from September 30, a different day. The honest reading is a plateau. Peter Sand, Xeneta's chief analyst, noted that the West Coast rate fell $2 on October 7, its first dip since mid-September, which he called a marginal move but a possible first sign of downward momentum.
Drewry's World Container Index is a step further along. On October 8 it showed Shanghai–Los Angeles down 3% to $7,624 and Shanghai–New York down 2% to $10,220, the first clear declines on both lanes, although Drewry itself expects rates to be stable next week. Freightos's FBX for October 6 showed China–West Coast down 3% to $8,322 and China–East Coast unchanged at $9,600, so only Drewry shows declines on both coasts in the same week. Drewry's Shanghai–Los Angeles rate is still about 230% above late September 2025 (The Meridian calculation). For 2027 negotiations, the distinction matters: only consecutive declines across all three benchmarks, not one benchmark's weekly move, would reliably confirm a correction.
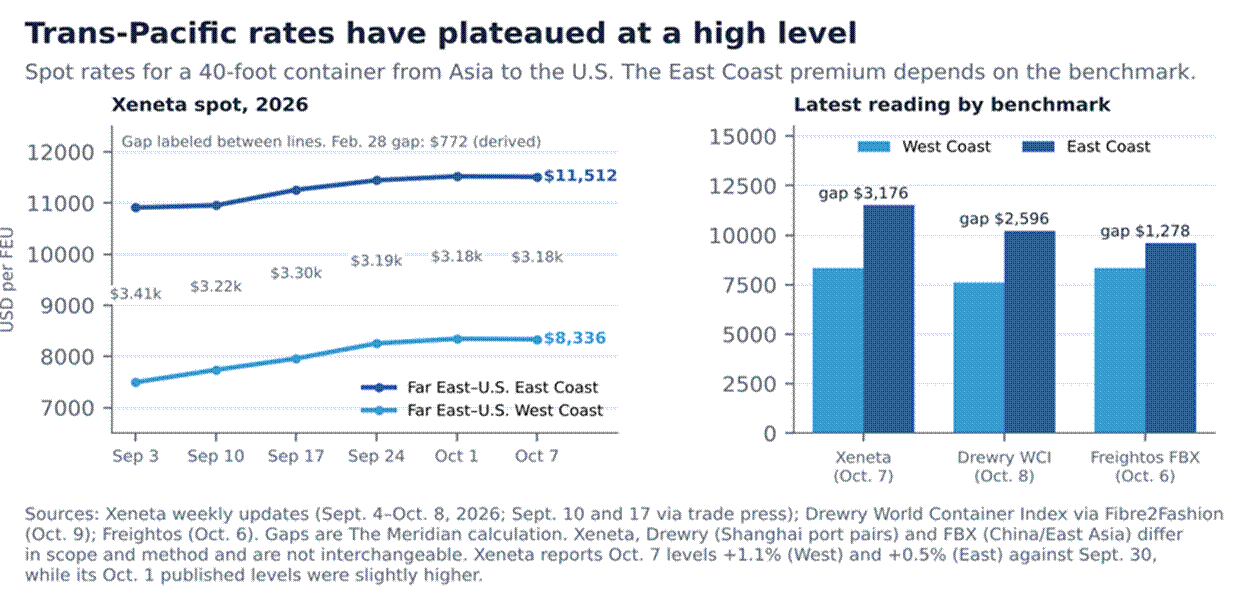
Xeneta's trans-Pacific rates rose through September and have been flat since. The East Coast premium is about $3,200 on Xeneta's measure, $2,600 on Drewry's and $1,300 on Freightos's, so the benchmark chosen moves the apparent premium by about $1,900, from roughly $1,300 to $3,200 (The Meridian calculation).
Demand is doing more of the work than The Meridian assumed
Observed import demand has not cooled. Descartes counted 2,546,261 TEU of U.S. containerized imports in September, up 10.3% from a year earlier, a record for the month and 24.8% above September 2019; imports from China rose 21.2% to 924,454 TEU, Reuters and Sourcing Journal reported. The National Retail Federation's Global Port Tracker, which forecasts a narrower group of major ports, raised its October estimate by 6.6% to 2.25 million TEU (+8.5%) and projects November at 2.00 million (−1.0%) and December at 2.02 million. Descartes's September figure is actual bill-of-lading data; NRF's figures from September onward are forecasts.
This revises The Meridian's reading of September 25, when the edition attributed the trans-Pacific surge mainly to lost capacity. Record arrivals show demand supporting rates more than that edition allowed, and 10.3% growth approached one of its stated invalidators, sustained double-digit import growth; a single month does not make it sustained. Some of the strength may reflect cargo moved early ahead of the November 10 fee deadline and the trade-truce dates, but the size of any front-loading has not been measured. September arrivals also reflect departures from several weeks earlier and say little about October bookings, which China's Golden Week holiday (October 1–7) depressed temporarily; forwarders described post-holiday bookings as steady so far, The Loadstar reported. NRF's projected November slowdown is therefore one of the conditions the base case rests on.
Capacity is returning at sea and tightening inland
At sea, the constraint is easing. Linerlytica estimates that capacity absorbed by port congestion fell from 4.3 million TEU (12.6% of the fleet) in late August to 3.76 million TEU (10.9%) on September 27; C.H. Robinson puts the share at about 12%, a four-year high, and 64% of the congestion is in Asia, according to Linerlytica, after about three months of weather-related disruption at Chinese ports described by Freightos. About 200,000 TEU of new ships were delivered in September with no demolitions, and Linerlytica's market barometer turned negative for the first time since January as TEU-mile demand growth fell below supply growth. Schedule reliability remains poor, at 49.9% in August.
Blanking is not holding rates up. Drewry's tracker shows 39 of 710 sailings (5%) cancelled in weeks 41 to 45, about half of them trans-Pacific, and Sea-Intelligence described current blanking as quite low for the post-pandemic era, against an average of about 10% of Asia–West Coast sailings since 2020; week-ahead trans-Pacific blank sailings fell from 11 to 4, according to Drewry. Carriers therefore hold a lever they have not pulled, and heavier blanking would be an early sign that they intend to defend rates.
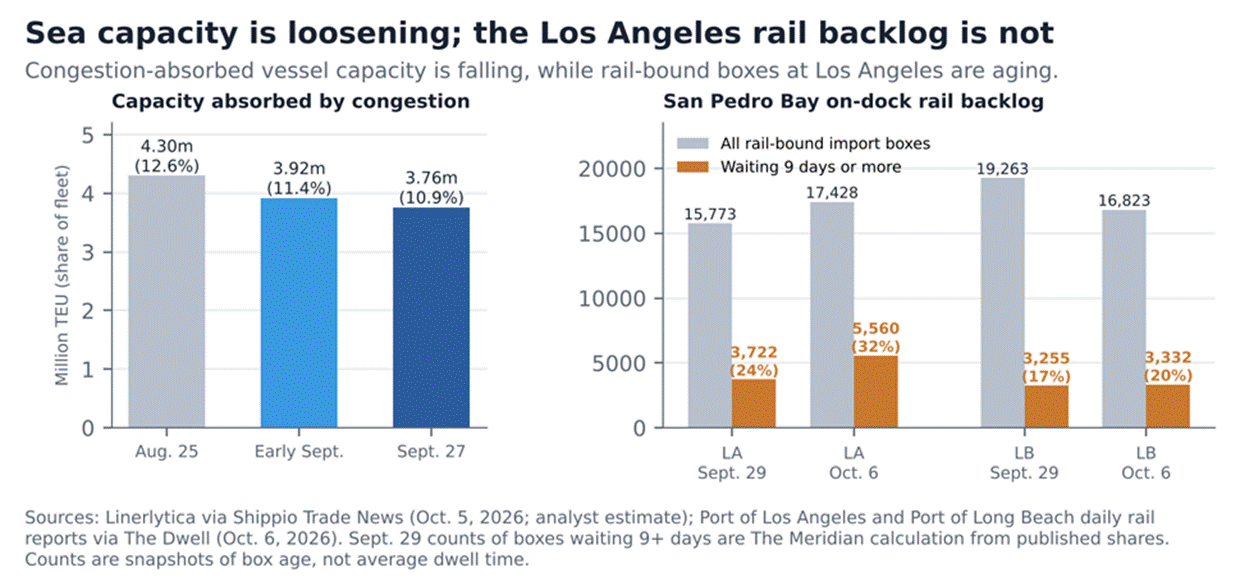
Congestion released about half a million TEU of vessel capacity in a month. At Los Angeles, the number of import boxes waiting nine days or more for rail rose by about half in a week.
Inland, the constraint is tightening. On October 6, Los Angeles had 17,428 import containers waiting for on-dock rail, 31.9% of them for nine days or more, against 15,773 and 23.6% on September 29, according to port data compiled by The Dwell. The backlog is concentrated: the oldest queues were at the FMS terminal (53.2% at nine days or more) and TraPac (45.7%), and BNSF accounted for 10,321 of the boxes, 4,427 of them nine days or older, against 7,107 for Union Pacific. That puts about 43% of BNSF-bound boxes at nine days or more, against roughly 16% of Union Pacific's (The Meridian calculation). Long Beach improved in total (16,823 boxes, down from 19,263), although the share at nine days or more edged up to 19.8%. Average rail dwell at the two ports was 6.75 days in August, a 2026 high, according to the Pacific Merchant Shipping Association. These counts are snapshots of container age, not average dwell, but the direction at Los Angeles is clear, even as the marine side remains fluid.
More volume is heading to this gateway. The Port of Los Angeles handled 955,907 TEU in August, part of its best three-month stretch on record, and Long Beach about 920,000; Gene Seroka, the Port of Los Angeles's executive director, estimated that more than 5% of cargo had shifted from East and Gulf Coast ports, The Loadstar reported. The Intermodal Association of North America described drayage capacity as dramatically constrained. For U.S. importers, the leg of the journey where capacity is loosening is not the leg where delays are building.
Why a lower ocean rate may not lower landed cost
The size of the East Coast premium depends on the benchmark. Xeneta measured it at $3,177 per FEU on October 1, up from $772 on February 28, and The Meridian calculates $3,176 on October 7. Drewry's Shanghai–New York minus Shanghai–Los Angeles gap was $2,596 and Freightos's about $1,280, mainly because Freightos's East Coast rate is about $1,900 below Xeneta's. Longer voyages, Panama Canal draft limits and rising East Coast port delays all contribute: Descartes reported delays rising at eight of the top ten U.S. ports, with New York–New Jersey up 1.5 days to 8.3 days. The canal constraint is easing. The Panama Canal Authority raised the maximum Neopanamax draft to 49 feet on September 28 and will offer 33 daily transit slots, including 10 for Neopanamax ships, from October 15.
Xeneta also expects the premium to narrow. Its three-month forecast, published October 2, is for East Coast rates of $6,000–7,000 and West Coast rates of $4,500–5,500, which Xeneta described as a sizeable correction but not a collapse; that would imply a premium of roughly $500–2,500 (The Meridian calculation). It is a Xeneta forecast and has not been observed, but it means a routing shift justified by today's premium could be judged against a much smaller one within a quarter.
None of these figures is a door-to-door saving. A sound gateway comparison weighs five things:
• Benchmark basis. The relevant premium is the one on the benchmark the importer's own rates follow.
• The inland leg. On current port data, BNSF cargo out of Los Angeles faces a far older rail queue than Union Pacific or Long Beach cargo, and IANA describes drayage capacity as dramatically constrained.
• Time and inventory. Longer waits can add demurrage, per-diem and carrying cost, offsetting part of any ocean saving; how much depends on cargo value and the length of the delay.
• Route reliability. East Coast delays are rising, while the canal's higher draft, from September 28, and added slots, from October 15, help the all-water route.
• Direction of the premium. If Xeneta's forecast holds, the incentive to reroute shrinks over the next three months.
The Meridian also sees a possible feedback effect, although the data do not establish it: if routing decisions follow the port-to-port premium, they add volume to the gateway whose inland constraint is worsening and could erode part of the saving that motivated them. Importers using San Pedro Bay rail should add buffer time for inland moves until the backlog clears.
The November 10 fee deadline
The suspension of the U.S. Trade Representative's Section 301 port fees on Chinese-linked ships removes payment liability through November 9, 2026. It did not reset the fee schedules, which escalated on April 17, 2026. If the suspension ends without further modification, the published schedules point to $80 per net ton for Chinese vessel operators and owners and, for operators of Chinese-built vessels, the higher of $23 per net ton or $153 per container discharged, charged up to five times a year per vessel. Earlier reports citing $50 per net ton, or $18 per net ton and $120 per container, refer to the first-stage rates. Treasury Secretary Bessent said on September 24 that the wider U.S.–China trade truce had been extended to January 10, 2027; FreightWaves reported that the truce announcement did not mention ship fees, and no USTR notice extending the fee suspension had been identified as of October 9.
Whether the fees apply, and how much carriers would pass through, remains uncertain. Because the fees fall on vessel calls, a shipper's exposure depends on its carriers' use of Chinese-operated or Chinese-built tonnage on U.S. services; the practical step is to establish each carrier's exposure and surcharge mechanism before November 10. Carriers have also filed trans-Pacific general rate increases for October 15 and November 1, as they have every half-month this year, and one non-vessel-operating carrier filed a $3,000 per 40-foot increase for November 1. There is no evidence yet that any of these increases has been realized; a realized one would be a meaningful signal.
What could change the conclusion
The correction could come faster. Linerlytica's negative barometer, a steady flow of new ships, easing congestion and low blanking all point to more capacity than the market needs once the peak passes, and capacity released from Asia–Europe as more services return to Suez could cascade into the Pacific. In that case, East Coast rates could fall quickly and the premium narrow within weeks. In the other direction, steady post-holiday bookings, realized rate increases or renewed front-loading ahead of the fee deadline could push rates back above their October 1 levels. A new disruption in the Red Sea or around Hormuz would change the picture across trades.
Implications for shippers
For 2027 trans-Pacific tenders, signing against current spot levels risks locking in a peak, while waiting carries volatility risk. Practitioners at Xeneta's budget roundtables described forecasting only about three months ahead and using structures of roughly 80% fixed and 20% index-linked volume; this is anecdotal and not a measured market share. The most exposed importers move interior-bound cargo by rail out of Los Angeles, particularly on BNSF on current port data; the best positioned can change gateway, railroad or contract basis as the premium and the inland queue move.
Truckload Rates Are Rising Without a Freight Boom
Prices up, accepted volume down
FreightWaves reported national dry-van spot rates including fuel of about $3.55 a mile in early October on its SONAR data, about 10% higher than in late August and about 50% higher than a year earlier. Over the same period, accepted tender volumes fell 3% in a week, 9% since mid-September and 20% from their June peak. The American Trucking Associations' for-hire tonnage index was 112.7 in August, 0.5% lower than in July and 1.6% lower than a year earlier; ATA's chief economist, Bob Costello, attributed recent strength to reduced capacity, not robust demand. Not every volume measure is weak: the Cass shipments index rose 2.1% year on year in August, its first gain in 42 months, and Truckstop reported load activity up 11%.
The usual assumption is that falling volume hands shippers leverage. That holds only while carrier capacity is stable: when usable capacity contracts faster than freight, the market tightens as volumes fall, and refusals of contracted loads are the most direct measure of that balance.
Usable capacity is the leading explanation
Carriers rejected 13.79% of contracted loads on SONAR's national tender rejection index in early October, down from a peak of 14.67%; a related SONAR index stood at 12.52%. FreightWaves estimates that rejections are about three times their 2023–25 range of 4–6% while volume over three years is up about 9%. SONAR data also suggest that the number of for-hire tractors fell by about 51,000 in August and that new-fleet tractors, at 19,520, were the fewest since early 2020; these are proprietary FreightWaves estimates whose methodology is not public. The Logistics Managers' Index transportation-capacity reading was 34.4 in September, its tenth month of contraction, while transportation prices were 92.7.
FreightWaves attributes the exits to insurance costs, which rose 3.9% in 2025 to 10.6 cents a mile, financing and compliance enforcement. English-language-proficiency enforcement is putting about 2,700 drivers out of service a month, and a federal rule on non-domiciled commercial licenses could affect up to 194,000 holders, a measure of regulatory exposure rather than confirmed removals. More than 2,000 new operating authorities a week reflect the mechanics of FMCSA's new registration system, and only about two in three new registrants are insured, so authority counts overstate usable capacity.
Other data cut the other way. Bureau of Labor Statistics truck-transportation employment was 1,473,100 in September, 800 more than a year earlier and the first annual gain since April 2023. Class 8 truck orders were 18,700 in September on ACT Research's count, 9.5% fewer than a year earlier, but 21,300 on FTR's, 3% more. Rejections have eased from their peak, spot linehaul fell over the summer and diesel is falling. Employment, tractor, authority and equipment-order data measure different things and cannot be reconciled into a single capacity count. The Meridian's assessment is that tighter usable capacity is the leading explanation for firm pricing, not a conclusively isolated cause.
Separating linehaul, contract and fuel
U.S. Bank and DAT, in their Freight Payment Index rates edition published October 1, report dry-van spot rates of $2.38 a mile in June, $2.35 in July and $2.17 in August, and contract rates of $2.30, $2.38 and $2.39, with the fuel surcharge reported separately and rising from $0.62 to $0.70 a mile. U.S. Bank describes linehaul pricing as softening. On that basis, spot linehaul fell 8.8% from June to August while contract rates rose 3.9%, leaving contract $0.22 a mile above spot in August (The Meridian calculation), and fuel's share of broker-to-shipper spot payments rose from 21% to 24%. Shippers' cost increases this summer came through contract rates and fuel more than through spot linehaul.
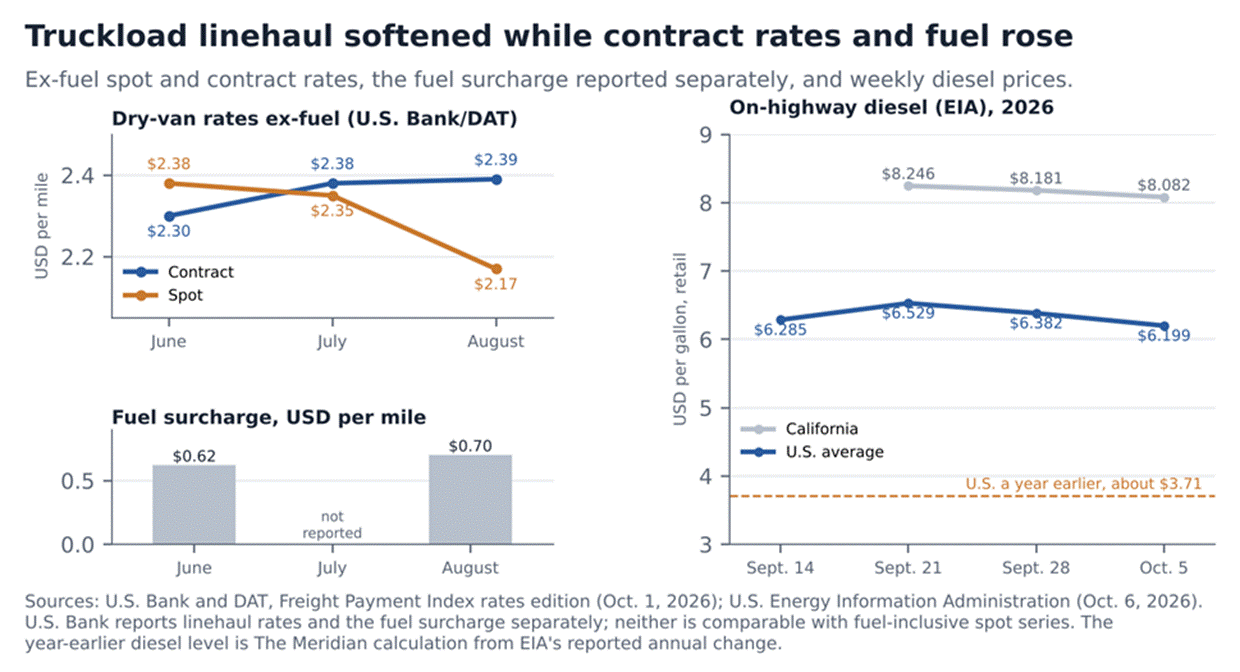
Ex-fuel spot linehaul fell from June to August while contract rates and the fuel surcharge rose. Diesel has eased since its September 21 record but remains far above a year earlier.
Year on year, ex-fuel rates are clearly higher. DAT's van spot linehaul rate was $2.17 a mile in the week to September 18, about 33% above a year earlier, according to DAT figures reported by Rose Rocket; the Cass Truckload Linehaul Index was 11.3% higher in August. EIA's national diesel average fell from a record $6.529 a gallon on September 21 to $6.199 on October 5, a 5.1% decline, but remained $2.488 above a year earlier. Because fuel-inclusive and ex-fuel series are often quoted side by side, the table sets out what each measures.
Truckload rate measures differ by basis
|
Measure |
Basis |
Period |
Reading |
|
U.S. Bank/DAT dry-van spot |
Linehaul; fuel surcharge reported separately |
August |
$2.17 a mile |
|
U.S. Bank/DAT dry-van contract |
Linehaul; fuel surcharge reported separately |
August |
$2.39 a mile |
|
U.S. Bank/DAT fuel surcharge |
Fuel only |
August |
$0.70 a mile |
|
DAT van spot linehaul (reported by Rose Rocket) |
Excluding fuel |
Week to Sept. 18 |
$2.17 a mile (+33% y/y) |
|
DAT van spot all-in (reported by Rose Rocket) |
Including fuel |
Sept. 13–19 |
$2.96 a mile |
|
Truckstop posted van (FTR analysis) |
Posted broker rate including fuel |
Week to Oct. 2 |
$2.68 a mile (+45% y/y) |
|
SONAR national van spot (FreightWaves) |
Including fuel |
Early October |
About $3.55 a mile |
Sources: U.S. Bank and DAT (Oct. 1, 2026); Rose Rocket (Sept. 23, 2026); Trucking Industry News reporting FTR and Truckstop (Oct. 5, 2026); FreightWaves (Oct. 5, 2026). Figures from different providers, samples and dates are not a time series and should not be compared directly.
The components could diverge again. If diesel keeps falling, fuel surcharges will follow with a lag set by each shipper's surcharge table and all-in cost per mile should ease, while The Meridian expects ex-fuel contract pricing to stay firm as long as rejections remain elevated. A freight budget tracked only on all-in cost could therefore show improvement in the fourth quarter while 2027 linehaul bids start from a firm base.
Reefer and specialized freight are tighter
Refrigerated carriers rejected 22.08% of tendered loads against 13.06% for dry vans, and rejections at Savannah reached 18.5%, according to SONAR data published by MegaCorp Logistics. DAT's reefer spot rate excluding fuel was 33.6% higher than a year earlier and its contract rate 15.6% higher, Beacon reported. Specialized spot rates were more than 30% higher year on year even as flatbed volume fell 5%, according to IntelliTrans data reported by Transport Topics. Food, chemical and industrial shippers using these equipment types face more pressure than the dry-van averages suggest.
Implications for 2027 carrier negotiations
Soft demand is not delivering rate relief, and tight capacity shows up in service as well as price. When roughly one contracted load in seven is refused, routing guides push freight to backup carriers or the spot market at higher all-in rates, so the effective rate a shipper pays blends its contract rate with backup and spot rates on refused loads. FreightWaves's contract-pricing pressure measure (SONAR VCRPM1), which tracks pressure on contract rates rather than publishing a rate, reached 270 on September 17, its highest since 2022, so 2027 bids start from a firm base. Linehaul relief requires capacity to return, which FreightWaves does not expect before early 2027. Four considerations follow.
• Award on acceptance as well as price. A lower rate from a carrier that refuses often can cost more in practice than a higher rate that holds.
• Build depth into routing guides. With refusals near 14%, backup carriers and pre-agreed overflow terms limit how much freight falls to the spot market.
• Split fuel from linehaul. Benchmark each separately and check how quickly fuel-surcharge tables reset as diesel falls.
• Convert where intermodal fits. C.H. Robinson reports truck-to-rail conversion on 550–1,500-mile lanes, along with regional chassis and container shortages and 2027 intermodal contract pricing that is steady to higher, rising fastest from West Coast origins; terminal dwell is a further limit.
The most exposed shippers have thin routing guides, heavy spot exposure, or reefer and specialized freight. The Meridian's view would change if rejections fell below 8% with flat volume or if independently measured tractor counts began to rise.
Airfreight Shippers Shift Toward Shorter, More Flexible Commitments
What the data shows
Xeneta reported on October 2 that 60% of new airfreight contracts signed in the third quarter of 2026 ran for three months or less, against 25% a year earlier and 47% in the second quarter. Contracts of exactly three months, a subset of that group, made up 42%, against 16%. Twelve-month contracts fell to 25% from 40%, and contracts longer than 12 months were 3%. Xeneta says shippers are seeking floating mechanisms before committing to long-term capacity; it did not measure how many have adopted them. The sample size and the mix of participants are not disclosed, and no second data provider has published comparable figures.
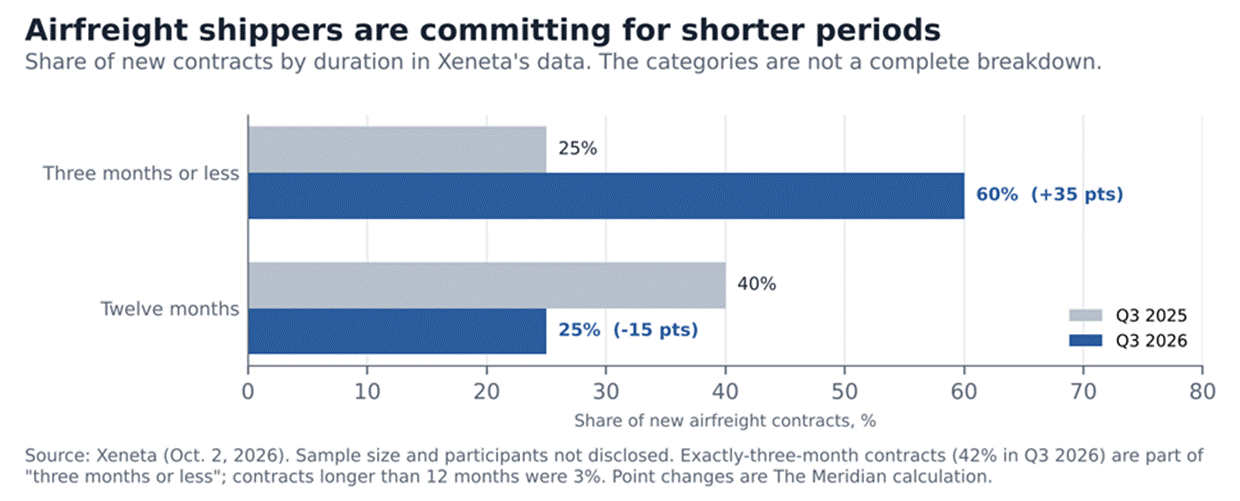
In Xeneta's data, the share of new contracts lasting three months or less more than doubled in a year, while 12-month contracts fell to a quarter of the total.
Why buyers are hesitating
Market conditions make fixed annual prices hard to set. Xeneta reported September demand 6% higher than a year earlier against capacity 2% higher, a dynamic load factor of 62% and a global spot rate of $3.10 a kilogram, 27% higher than a year earlier. Fuel is the most visible risk: IATA reported jet fuel 79.2% more expensive than a year earlier in August, and The Loadstar reported prices more than double year-earlier levels by early October. Security disruption in the Gulf is a second: attacks on Riyadh's airport cut outbound capacity from the city by 34% within a day, and European freighter capacity was reported 28% lower, according to industry capacity data cited by The Loadstar. Policy is a third. The European Union abolished the €150 (about $170) customs-duty exemption for low-value imports on July 1 and introduced a temporary €3 (about $3.40) duty per item in distance-sale consignments under Council Regulation (EU) 2026/382; items are counted under the tariff-classification rules, not as every physical unit in a parcel. Xeneta and the Trade and Transport Group, analyzing Chinese customs data, estimate that China–Europe e-commerce air volumes fell 40% year on year in August. The data do not establish how much each factor contributes to shorter contracting.
Duration, price and capacity are separate decisions
A shorter contract is not the same as moving to spot. Duration, pricing mechanism and capacity commitment can be set independently: an annual capacity agreement can carry an index-linked or fuel-adjusted price, and a three-month contract can still be a fixed-price commitment. Xeneta's figures describe only duration. Shorter terms are most valuable when price inputs are volatile and lanes are moving apart, as they are now; a buyer on quarterly terms can reprice as fuel, Gulf security or EU policy shifts a corridor, instead of carrying a rate set at today's elevated fuel prices. They also have costs: more frequent tendering, less certainty of space when capacity is withdrawn suddenly, as it was at Riyadh, and exposure to repricing if the peak proves strong. A capacity commitment with fuel-indexed pricing offers a middle path between fixed annual rates and the spot market.
The evidence has limits. A quarter of new contracts remain annual, and the rise in the short-duration share could reflect fewer long-term deals being signed rather than more short ones. It supports an adaptation in procurement; it does not show the end of annual contracting.
Rates diverge by lane
Lane conditions differ sharply. IATA reported Asia–North America traffic up 13.2% in August and Europe–Middle East down 12.1%. TAC Index data put Hong Kong–North America at $7.02 a kilogram in September, 31% higher than a year earlier, and Hong Kong–Europe at $4.80, 8.8% higher; those averages blend spot and contract. Freightos reported China–North America at $5.60, down more than 15% in recent weeks, and China–Europe at $3.83, down 7%. Spot rates from India were about 70% higher than a year earlier to the United States and 80% higher to Europe, The Loadstar reported. Views of the peak differ: Xeneta expects a muted final quarter, while Cathay Pacific expects a strong peak season, according to The Loadstar.
Structural or cyclical
The central question is whether the shift outlasts the conditions behind it. If jet fuel and Gulf capacity normalize, shippers could return to longer fixed-price terms at lower levels. If volatility persists, quarterly or index-reviewed contracting could become standard for a larger share of buyers. Xeneta's fourth-quarter data will be the first test. The Meridian holds the view that short-duration agreements will remain above half of new contracts with LOW CONFIDENCE, reflecting the single source and single quarter of evidence.
Implications for air buyers
Air buyers should treat duration, price mechanism and capacity commitment as separate terms in requests for quotation, benchmark lane by lane rather than on global averages, and budget for quarterly or index-based reviews. Manufacturers relying on air for urgent shipments should weigh the cost of higher safety stock against expedite costs in a market where ocean reliability remains below 50%.
CONTAINERIZED OCEAN FREIGHT — TRANS-PACIFIC
China-origin composite indexes edged lower: the Shanghai Containerized Freight Index fell 0.7% to 3,662.3 and the Korea Containerized Freight Index 1.1% to 4,629, although KCCI North America rates rose slightly. Catalysts over the next month are the October 15 and November 1 rate increases, the Panama Canal's move to 33 daily slots on October 15, the November 9 end of the fee suspension and NRF's November forecast. Rates, demand, capacity and the inland backlog are analyzed in the lead editorial.
CONTAINERIZED OCEAN FREIGHT — TRANSATLANTIC
Transatlantic moves were small and depended on the benchmark. Freightos's Europe–U.S. East Coast index rose from $2,666 to $2,723 per FEU in week 40, while Xeneta's North Europe–U.S. East Coast rate fell 1.1% to $2,854. The U.S. East Coast–Europe backhaul fell from $1,003 to $963 on the Freightos index, about a third of the fronthaul level. The available data do not show why the backhaul weakened, and Los Angeles export figures are not a reliable guide to East Coast export demand.
CONTAINERIZED OCEAN FREIGHT — LATIN AMERICA & OTHER MAJOR TRADES
Rates diverge by coast. Freightos's Europe–East Coast South America index eased to $1,196 per FEU while Europe–West Coast South America rose to $2,380. Hapag-Lloyd has announced a peak-season surcharge of $500 per 20-foot and $1,000 per 40-foot container on shipments from East Coast South America to North America, Central America and the Caribbean from November 5 for 30 days; it is announced, not realized. Intra-Asia rates are at records: Drewry's intra-Asia index rose 2% to $1,518 per 40-foot container, its sixth straight record, and Linerlytica puts intra-Asia rates 177% above end-February, although composites may not apply evenly across lanes. In Mexico, the terminal operator at Manzanillo reports about 80% utilization with imports up 4–4.5%, while Lázaro Cárdenas imports fell about 8%; these are operator statements with unspecified comparison periods. Mexican intermodal rail volume rose 36.7% year on year in AAR's week 39 data.
OCEAN CARRIER CAPACITY, ALLIANCES & NETWORKS
Asia–Europe is the clearest case of capacity being released. Xeneta's Far East–North Europe rate was $3,645 per FEU on October 7 and Far East–Mediterranean $4,007, down 34% and 43% since July 1, and the gap between the two has narrowed from about $2,000 at its January peak to about $400. Drewry's Shanghai–Rotterdam rate was $3,337 and Shanghai–Genoa $3,696 on October 8, and Asia–Europe lanes have fallen for 13 consecutive weeks on Drewry's index. More services are returning through Suez: the Premier Alliance (ONE, HMM and Yang Ming) will route its FE1 loop through the canal, starting with the 8,110 TEU ONE Continuity from Laem Chabang on October 17, and Hapag-Lloyd's SE1 follows from October 27. Suez containership transits rose from 139 in March to 221 in September, according to data compiled by Safety4Sea, and returns remain selective and gradual. Estimates of the Red Sea share differ by definition: about 35% of Asia–Europe sailings on MSI's count against 27% of capacity on Sea-Intelligence's.
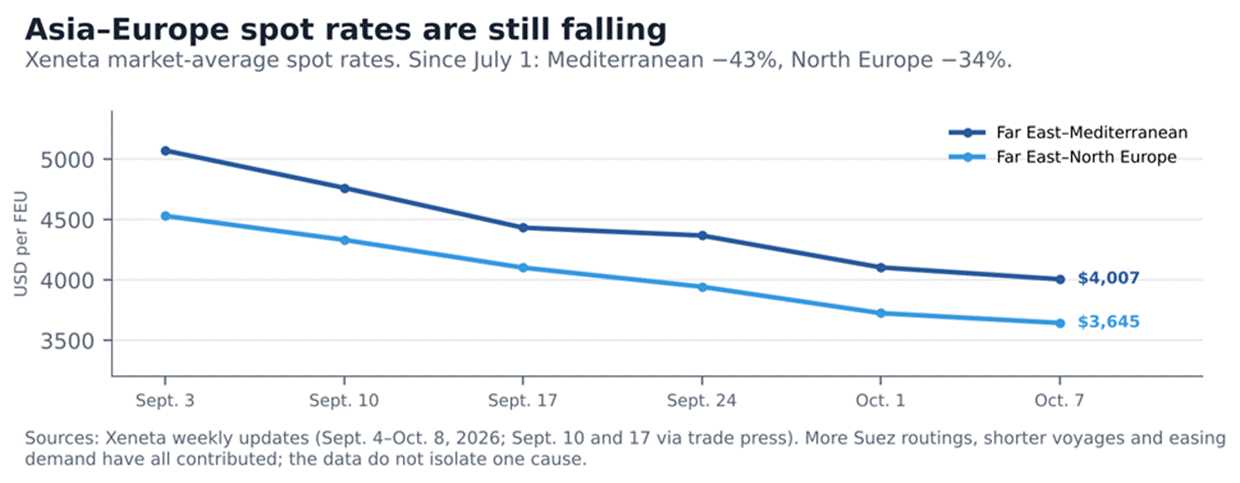
Xeneta's Asia–Europe rates fell every week from early September. The decline is slowing, and Xeneta says rates have not yet reached a floor.
Shorter voyages through Suez release ships and add effective capacity, but Xeneta also points to easing demand, and the available data do not isolate one cause; The Meridian treats the Suez returns as one contributor. Rates remain well above pre-crisis levels. Carriers are attempting increases of about $1,000 per 40-foot container in the second half of October, and Xeneta's Peter Sand said the market is not at the floor yet. The significance extends beyond Europe: capacity released from Asia–Europe could cascade into the Pacific and speed any trans-Pacific decline.
BREAKBULK, MULTIPURPOSE & PROJECT CARGO
NO MATERIAL DEVELOPMENT IDENTIFIED. The Toepfer Multipurpose Index, a vessel time-charter index rather than a cargo freight rate, was $12,832 a day in September, $7 above August, and the larger-ship TMI-500 was $17,669, up 0.37%. Current values of Drewry's breakbulk freight indices were not available. Both remain watchpoints, along with fourth-quarter project awards.
NORTH AMERICAN FULL TRUCKLOAD
In posted-rate data for the week to October 2, Truckstop's van rate including fuel was $2.68 a mile (+45% year on year), reefer $3.54 and flatbed $3.35, with load activity up 11%, according to FTR. Diesel prices vary widely by region, from $5.699 a gallon in the Lower Atlantic states to $8.082 in California, so fuel-inclusive comparisons across regions mislead. The second editorial carries the analysis of capacity, pricing and 2027 bids.
NORTH AMERICAN LESS-THAN-TRUCKLOAD
Old Dominion's average 4.9% general rate increase took effect on October 5; the company says the increase varies by lane and customer, and realized pricing will not be visible until later. Old Dominion's August revenue per day rose 12.4% while tons per day fell 0.9% and shipments 2.4%; quarter-to-date revenue per hundredweight rose 11.3%, or 4.8% excluding fuel, a figure that also reflects shipment mix. Other carriers are growing volume: Saia's August tonnage rose 8.7% on 1.1% more shipments, XPO's shipments rose 5.7% and tonnage 3.7%, and ArcBest's tonnage rose about 9% while shipments fell 4%. Heavier shipments at several carriers are consistent with some truckload freight moving into LTL, Trucking Dive reported; if so, LTL is acting as a partial outlet for tight truckload capacity. Old Dominion's pricing should not be generalized to the sector.
RAIL & INTERMODAL
Intermodal volume is elevated. IANA's October nowcast stood at 105.1 (2017–19 = 100), 5.5% above a year earlier and 0.3% below September; it is an estimate, and final volume may differ. AAR reported 299,001 U.S. intermodal units in the week ending October 3, up 7.4%, and year-to-date volume up 4.2%. C.H. Robinson reports truck-to-rail conversion on 550–1,500-mile lanes, regional chassis and container shortages, and 2027 intermodal contract pricing steady to higher, rising fastest from West Coast origins. Class I system service is broadly stable: Union Pacific's terminal dwell was 20.0 hours against 19.8 and 19.5 in prior weeks, and Norfolk Southern's 24.4 hours. Intermodal is a plausible cost hedge against tight truckload capacity, limited by terminal dwell, equipment availability and the Los Angeles rail backlog. Public lane-level price comparisons between truck and intermodal are not available.
AIRFREIGHT
IATA reported August demand up 4.4% with capacity down 0.1% and a cargo load factor of 46.0%, 2.0 points higher; Xeneta's dynamic load factor of 62% uses a different method and is not comparable. WorldACD reported week-39 tonnage up 5% year on year and prices up 27%, with Asia Pacific–U.S. prices up 38%; the Baltic Air Freight Index was 25.5% higher than a year earlier. The European Commission notes that a separate EU handling fee on distance-sale imports could apply from November 2026 at the earliest. The third editorial covers contract duration.
DRAYAGE, PORTS & TERMINAL CONDITIONS
Marine and inland conditions are diverging at San Pedro Bay. Two ships were waiting for berths at Los Angeles and Long Beach, within the normal range, and truck planning-time was 44% below its median, The Dwell reported, while the rail backlog worsened (see the lead editorial). Loaded imports at the two ports were about 967,000 TEU in August against a trailing-year norm of about 848,000. Savannah set a September record of 504,015 TEU, up 3.7%, with loaded imports up 5.5%, gCaptain reported. IANA's description of drayage capacity as dramatically constrained is an industry characterization rather than a measured national figure. September totals for Los Angeles and Long Beach had not been released by October 9.
SERVICE RELIABILITY, ROUTING & NETWORK DISRUPTION
Global schedule reliability was 49.9% in August, 5.9 points lower than July and the lowest since September 2022, with Asian ports at 32.3%, Shanghai at 12.2% and late vessels arriving 6.81 days behind schedule on average, Sea-Intelligence reported; the September figure is due later this month. The Panama Canal's higher draft and slot count are structural improvements tied to Gatun Lake levels. Suez returns are reversible routing decisions driven by security assessments. The Gulf remains volatile: only seven commodity ships transited Hormuz on October 6, the fewest since July 23, crude flows were about 74% of prewar levels and attacks on tankers reached their highest weekly level of the war, according to Kpler and LSEG data reported by The National. These are fast-moving security conditions that can reverse rate trends across ocean and air.
FREIGHT PROCUREMENT & SHIPPER ECONOMICS
Procurement is moving toward flexibility and shorter review cycles across modes, at a time when the main freight markets are moving in different directions. In ocean, practitioners describe hybrid fixed and index-linked structures and three-month forecasting horizons; Xeneta's Peter Sand noted that falling Asia–Europe spot rates help European shippers in tender season and that forwarders are reportedly getting better long-term deals. In trucking, contract repricing pressure is high going into 2027 bids. In air, short-duration contracting has risen sharply. With one market correcting, another tightening and a third diverging by lane, a single annual negotiating calendar suits none of them well. The Logistics Managers' Index logistics-costs reading was 246.1 in September, its highest since April 2022, with warehouse capacity at 39.3; these are survey-based diffusion indicators that do not measure dollar costs. No quantified adoption rate exists for ocean hybrid structures or air floating mechanisms.
CROSS-MODAL & CROSS-LAYER FREIGHT IMPLICATIONS
Headline indices and landed cost are diverging: Asia–Europe ocean rates are falling while U.S. truckload pricing is rising, and inland dwell can offset ocean savings. Six channels carry most of the cost and risk moving between modes.
|
Channel |
What is moving |
Where the cost or risk lands |
|
Ocean → inland |
Congestion is releasing vessel capacity while rail-bound boxes
at Los Angeles age. |
Landed cost and transit time: longer waits can add demurrage,
per-diem and carrying cost that offset part of any ocean saving. |
|
Energy → freight costs |
Diesel is $2.49 a gallon above a year earlier; jet fuel is
more than double; very-low-sulfur fuel oil was $867.50 a tonne in Singapore. |
Surcharges in every mode, at different lags. Falling diesel
lowers truck invoices before any linehaul relief, which can obscure firm
pricing. |
|
Trade policy → carrier networks |
The U.S. port-fee suspension ends November 9 unless modified;
the EU abolished its low-value duty exemption on July 1. |
Possible fleet substitution, surcharge filings or
front-loading on the trans-Pacific. Xeneta and the Trade and Transport Group
estimate China–Europe e-commerce air volumes fell 40% year on year in August;
the duty's share of that fall is not measured. |
|
Ports and rail → working capital |
Suez routings shorten Asia–Europe voyages by one to two weeks;
the Los Angeles rail backlog lengthens U.S. inland transit. |
Inventory released for European importers and tied up for U.S.
importers; reliability below 50% strengthens the case for safety stock or air
expedites. |
|
Truck capacity → rail and LTL |
Tender rejections near 14% with accepted volume 20% below its
June peak. |
Incentives to convert suitable lanes to intermodal, limited by
terminal dwell, equipment shortages and the Los Angeles backlog; heavier LTL
shipments are consistent with some shift. |
|
Security → vessel and aircraft capacity |
Suez returns are adding Asia–Europe capacity; Hormuz transits
fell to their lowest since July 23; Riyadh outbound air capacity fell 34% in
a day. |
Capacity can be released or withdrawn faster than demand
changes; Asia–Europe tonnage could cascade into the Pacific, and a security
reversal would undo it. |
Sources: as cited in this edition.
Read together, the channels point the same way for U.S. shippers. Relief available at sea can be partly absorbed on land, and much of the risk to the outlook comes from fuel, policy and security, which can move faster than demand. That argues for judging freight performance on service-adjusted, landed cost rather than on any single benchmark.
Meridian Outlook
None of The Meridian's Freight Rates & Trends calls has been resolved by the forecast record, so this edition carries no Prior Outlook Audit. The six calls published on September 25 remain open, as does a related trade-policy call. Of two earlier outlook views that the forecast record scores separately, one remains open and one is shown as Pending Verification: its evaluation window closed on October 1 and its terms are unchanged, but the evidence needed to score it has not yet been fully reviewed. The table records evidence since publication without classifying any call.
Open and pending calls: evidence since publication
|
Call |
Proposition |
Evidence since publication |
Status |
|
FRT-20260925-01 |
Drewry Shanghai–LA and Shanghai–NY each post two consecutive
weekly declines before Oct. 31 |
Shanghai–LA: $7,838 (Sept. 24), $7,835 (Oct. 1), $7,624 (Oct.
8). Shanghai–NY: $10,373, $10,428, $10,220 |
Open |
|
FRT-20260925-02 |
Xeneta Far East–USEC sets no record above $12,683 in 2026 |
Highest reading since publication $11,523 (Oct. 1); $11,512 on
Oct. 7 |
Open |
|
FRT-20260925-03 |
Xeneta Far East–USEC between $6,000 and $10,000 on its last
November reading |
$11,512 on Oct. 7; Xeneta's own forecast range is $6,000–7,000 |
Open |
|
FRT-20260925-04 |
Sea-Intelligence September reliability above 49.9% |
September figure not yet published |
Open |
|
FRT-20260925-05 |
Drewry Shanghai–Rotterdam below $3,485 at end-October, absent
a Red Sea reversal |
$3,337 on Oct. 8; carriers are adding Suez routings |
Open |
|
FRT-20260925-06 |
EIA diesel below $6.529 on its last October reading |
$6.382 (Sept. 28); $6.199 (Oct. 5) |
Open |
|
FRT-20260828-01 (earlier outlook) |
Drewry Shanghai–NY premium over Shanghai–LA at least $2,000
every week, Sept. 3–Oct. 1 |
Gap $2,682 (Sept. 17), $2,535 (Sept. 24), $2,593 (Oct. 1);
Sept. 3 and Sept. 10 readings not reviewed here |
Pending Verification (window closed Oct. 1) |
|
FRT-20260904-01 (earlier outlook) |
SCFI Shanghai–USWC lower at end-October than $7,242 |
Lane value not reviewed for this edition; SCFI composite −0.7%
to 3,662.3 |
Open |
|
TPG-20261005-03 (Trade Policy) |
U.S. port-fee and China rare-earth suspensions extended or
folded into the truce by Nov. 10 |
Truce extension to Jan. 10 announced Sept. 24; no USTR notice
on the fee suspension identified |
Open |
Status reflects the forecast record on October 8, 2026; the Pending Verification designation is introduced in this edition. Open: the evaluation date or condition is still ahead. Pending Verification: the evaluation date has passed, but the evidence required to score the call has not been fully reviewed; the call's original terms stand unchanged. Outcomes are determined by The Meridian's forecast record on each call's evaluation date.
BASE CASE (October 2026 through January 2027, with procurement effects into the first quarter of 2027; MODERATE CONFIDENCE). Freight markets stay divergent. Trans-Pacific spot rates soften gradually from elevated levels as November imports slow and congestion eases, with East Coast rates falling more in dollars, but the decline is slowed by still-solid arrivals and inland constraints. Asia–Europe continues to correct as voyage capacity normalizes. Truckload pricing excluding fuel stays firmer than demand alone would justify, while all-in rates track diesel. Airfreight stays elevated but highly lane-specific, with short-duration procurement prominent. Confidence is higher on the direction of these markets than on the pace of the ocean correction or the durability of the procurement changes.
PRINCIPAL EVIDENCE. Easing congestion (3.76 million TEU), low blanking (5%), September deliveries of about 200,000 TEU and Linerlytica's negative barometer; NRF's projected November decline; record September imports; Los Angeles rail backlog; truckload rejections near 14% with accepted volumes 20% below June; contract-pricing pressure at a 2022 high; strong intermodal volumes; air demand growing faster than capacity; and more Asia–Europe services returning through Suez.
CONTRARY CASE. Carrier competition and new ships produce a rapid trans-Pacific decline that collapses the East Coast premium within weeks; falling diesel and returning capacity cut truckload rates and give shippers leverage in first-quarter bids; normalizing Gulf capacity and jet fuel restore longer air contracts.
WHAT WOULD STRENGTHEN THE BASE CASE. Consecutive trans-Pacific declines across Xeneta, Drewry and Freightos at a gradual pace; continued low blanking; congestion below 3.5 million TEU; truckload rejections staying above 10%; air dynamic load factors above 60%; additional Suez loop returns.
WHAT WOULD WEAKEN IT. Realized ocean rate increases; renewed import front-loading; truckload rejections falling below 8% with flat volume; rising independently measured tractor counts; air spot declines despite constrained capacity; a worsening rail backlog that limits intermodal conversion.
INVALIDATORS. A major new Red Sea or Hormuz disruption that diverts tonnage; abrupt policy-driven front-loading that lifts trans-Pacific rates above their October 1 levels; a broad return of truckload capacity that drives rejections and ex-fuel rates down together; a sustained rebound in the annual share of new air contracts; a security-driven reversal of Suez routings.
WHAT WOULD MOVE THE MERIDIAN'S POSITION. Among the weakening conditions, two would carry the most weight. In ocean, realized rather than filed rate increases on October 15 or November 1 would show that carriers retain pricing power and push the expected correction later. In trucking, rejections falling below 8% with flat volume would be the clearest sign that capacity is returning and that shippers will have more leverage in 2027 bids than this edition assumes.
CALLS TO AUDIT. These are new and do not repeat the open calls above. Each states its own evaluation condition:
• The gap between Xeneta's Far East–U.S. East Coast and Far East–U.S. West Coast spot rates will be below $3,000 per FEU in the last Xeneta weekly ocean market update published in November 2026, using the October 7 basis of $11,512 minus $8,336. Evaluated on that update. MODERATE CONFIDENCE.
• Drewry's World Container Index assessment for Shanghai–Los Angeles in the last WCI published in November 2026 will be below its October 8 level of $7,624 per 40-foot container. Evaluated on that assessment. MODERATE CONFIDENCE.
• The Cass Truckload Linehaul Index for December 2026, as first published by Cass Information Systems, will be higher than in December 2025. Evaluated on that release, expected in mid-January 2027. MODERATE CONFIDENCE.
• AAR-reported U.S. intermodal volume for the fourth quarter of 2026 (the 13 weeks reported for October through December) will be higher than for the same weeks of 2025. Evaluated on AAR's final weekly report of 2026. MODERATE CONFIDENCE.
• In Xeneta's next published airfreight contract-duration data, covering new contracts in the fourth quarter of 2026, agreements of three months or less will account for more than 50% of new contracts. If Xeneta does not publish the figure, the call cannot be evaluated. LOW CONFIDENCE.
Decision calendar
|
Date |
Decision point |
Status |
|
Oct. 15 |
Trans-Pacific general rate increases; Panama Canal moves to 33
daily slots |
Filed; scheduled |
|
Oct. 17 |
First Premier Alliance FE1 sailing via Suez (ONE Continuity,
Laem Chabang) |
Scheduled |
|
Second half of October |
Asia–Europe FAK increase attempts of about $1,000 per 40-foot |
Announced |
|
Oct. 26 |
Last October EIA diesel reading; evaluation reading for
FRT-20260925-06 |
Scheduled |
|
Oct. 27 |
Hapag-Lloyd SE1 begins routing via Suez |
Scheduled |
|
Late October |
Sea-Intelligence September reliability; Old Dominion
third-quarter results; IATA September data |
Expected |
|
Nov. 1 |
Trans-Pacific general rate increases, including an NVOCC
$3,000 per 40-foot filing |
Filed |
|
Nov. 5 |
Hapag-Lloyd peak-season surcharge, East Coast South America to
North America |
Announced |
|
Nov. 9–10 |
End of the USTR port-fee suspension unless modified; fees
could apply from Nov. 10 |
Pending USTR action |
|
November |
NRF Global Port Tracker update; earliest start of a planned EU
handling fee on distance sales |
Expected |
|
Mid-January 2027 |
Cass December Truckload Linehaul Index |
Expected |
|
Jan. 10, 2027 |
End of the extended U.S.–China trade truce |
Announced |
|
Early 2027 |
Xeneta fourth-quarter airfreight contract-duration data |
Expected |
Sources: as cited in this edition.
Signals to Watch
Ocean
• Weekly direction of Xeneta, Drewry and Freightos trans-Pacific rates, read together; consecutive declines on all three at a gradual pace would strengthen the base case.
• Realized, not filed, October 15 and November 1 rate increases.
• Drewry's October 15 and later assessments, which bear on FRT-20260925-01; whether the $3 Shanghai–Los Angeles move on October 1 counts as a weekly decline is for the forecast record to determine.
• Linerlytica's congestion-absorbed capacity (below 3.5 million TEU would strengthen the base case) and monthly fleet deliveries.
• The number of Asia–Europe loops returning through Suez and weekly deployed capacity.
• Sea-Intelligence September and October schedule reliability.
Ports, rail and intermodal
• Los Angeles and Long Beach rail-bound boxes waiting nine days or more, and rail outbound moves.
• NRF's November forecast against actual port totals.
• IANA and AAR intermodal volumes and railroad terminal dwell.
Truckload, LTL and fuel
• Truckload tender rejections (above 10% supports the base case; below 8% with flat volume weakens it), accepted tender volumes and DAT linehaul excluding fuel.
• EIA diesel and the lag into shipper fuel-surcharge tables.
• Independently measured active tractors and insured carrier capacity.
• Old Dominion and peer revenue per hundredweight excluding fuel, and realized GRI levels.
Air
• Air dynamic load factors (above 60% supports the base case), the global spot rate and corridor capacity.
• Xeneta's fourth-quarter airfreight contract-duration data.
• China–Europe low-value e-commerce volumes under the EU duty.
Policy
• Any USTR notice on the November 10 fee deadline, and carrier surcharge announcements.
Sources
• Xeneta — Xeneta Weekly Ocean Container Shipping Market Update – 08.10.26, October 8, 2026. https://www.xeneta.com/news/xeneta-weekly-ocean-container-shipping-market-update-08.10.26
• Xeneta — Xeneta Weekly Ocean Container Shipping Market Update – 02.10.26, October 2, 2026. https://www.xeneta.com/news/xeneta-weekly-ocean-container-shipping-market-update-02.10.26
• Xeneta — Xeneta Weekly Ocean Container Shipping Market Update – 24.09.26, September 24, 2026. https://www.xeneta.com/news/xeneta-weekly-ocean-container-shipping-market-update-24.09.26
• Xeneta — Xeneta Weekly Ocean Container Shipping Market Update – 04.09.26, September 4, 2026. https://www.xeneta.com/news/xeneta-weekly-ocean-container-shipping-market-update-04.09.26
• Safety4Sea (reporting Xeneta) — Xeneta: Red Sea capacity returns as China–Middle East container rates hit new records, September 11, 2026. https://safety4sea.com/xeneta-red-sea-capacity-returns-as-china-middle-east-container-rates-hit-new-records/
• MarineLink (reporting Xeneta) — Xeneta Shares Weekly Ocean Container Shipping Market Update, September 21, 2026. https://www.marinelink.com/news/xeneta-shares-weekly-ocean-container-543127
• Fibre2Fashion (reporting Drewry) — Drewry WCI dips 1.87% as China's Golden Week hits demand, October 9, 2026. https://www.fibre2fashion.com/news/textile-news/drewry-wci-dips-1-87-as-china-s-golden-week-hits-demand-314118-newsdetails.htm
• Shippio Trade News (compiling Drewry and Linerlytica) — Shippio Trade News, October 5, 2026, October 5, 2026. https://note.com/shippiotradenews/n/n6eab0757b45d
• FreshPlaza (reporting Drewry) — Transpacific container rates rise up to 7% as Asia-Europe falls up to 9%, September 22, 2026. https://www.freshplaza.com/north-america/article/9875408/transpacific-container-rates-rise-up-to-7-as-asia-europe-falls-up-to-9/
• gCaptain (reporting Drewry) — Container Rates Edge Lower Ahead of Golden Week as Suez Traffic Returns, September 24, 2026. https://gcaptain.com/container-rates-edge-lower-ahead-of-golden-week-as-suez-traffic-returns/
• Daily Cargo News (reporting Drewry) — World Container Index – 25 September 2025, September 25, 2025. https://www.thedcn.com.au/news/world-container-index-25-september-2025
• Freightos — Premier Alliance joins Red Sea return – October 6, 2026 Update, October 6, 2026. https://www.freightos.com/freight-resources/premier-alliance-joins-red-sea-return-october-6-2026-update/
• Baltic Exchange — Container report – Week 40, October 2, 2026. https://www.balticexchange.com/en/data-services/WeeklyRoundup/Container/News/2026/container-report-week-40.html
• Chosun Ilbo — Container Freight Rates Dip Slightly Amid Europe-Mediterranean Weakness, October 7, 2026. https://www.chosun.com/english/national-en/2026/10/07/4JCWJGNLIBDN3HCL7BK3TBMEMU/
• Linerlytica — Market Pulse 2026 Week 40, October 5, 2026. https://www.linerlytica.com/post/market-pulse-2026-week-40/
• Linerlytica — Premier Alliance returns to Suez route on FE1 service, September 30, 2026. https://www.linerlytica.com/post/premier-alliance-returns-to-suez-route-on-fe1-service/
• Safety4Sea — Suez return gains momentum as Asia-Europe capacity pressures mount, October 1, 2026. https://safety4sea.com/suez-return-gains-momentum-as-asia-europe-capacity-pressures-mount/
• Maritime News — Suez Canal traffic recovery gains steam as carriers resume services, October 7, 2026. https://www.maritimenews.com/suez-canal/suez-canal-traffic-recovery-gains-momentum
• Panama Canal Authority — Panama Canal announces increase in draft and daily transit, September 28, 2026. https://pancanal.com/en/panama-canal-announces-increase-in-draft-and-daily-transit/
• The National (Reuters; Kpler and LSEG data) — Hormuz traffic hits lowest level in two months as tanker attacks surge, October 8, 2026. https://www.thenationalnews.com/business/2026/10/08/hormuz-traffic-hits-lowest-level-in-two-months-as-tanker-attacks-surge/
• C.H. Robinson — Ocean Shipping Freight Market Update, October 2026, October 1, 2026. https://www.chrobinson.com/en-us/resources/insights-and-advisories/north-america-freight-insights/oct-2026-freight-market-update/ocean/
• The Loadstar — Capacity conundrum for shippers as carriers unveil post-Golden Week blanks, October 6, 2026. https://theloadstar.com/capacity-conundrum-for-shippers-as-carriers-unveil-post-golden-week-blanks/
• Distribution-Publications, Inc. (Signals) — Transpacific Eastbound Carriers File GRIs Effective October 15, 2026, and November 1, 2026, October 7, 2026. https://dpiusa.com/signals/
• JAS Forwarding (agent for Blue World Line) — General Rate Increase – Transpacific Eastbound Trade, effective Nov 1, 2026, October 1, 2026. https://www.jas.com/wp-content/uploads/2026/10/GRI-Nov-1-2026.pdf
• DatamarNews (reporting Hapag-Lloyd) — Hapag-Lloyd sets PSS on East Coast South America shipments from Nov. 5, October 6, 2026. https://datamarnews.com/noticias/hapag-lloyd-sets-pss-on-east-coast-south-america-shipments-from-nov-5/
• National Retail Federation and Hackett Associates — Import Cargo's Extended Peak Season Wrapping Up (Global Port Tracker), October 8, 2026. https://nrf.com/media-center/press-releases/import-cargo-s-extended-peak-season-wrapping-up
• Sourcing Journal (reporting Descartes and NRF) — 'We're Likely Past the Busiest Part of the Year,' NRF Says, But Imports Still Elevated, October 9, 2026. https://wwd.com/sourcing-journal/logistics/nrf-peak-shipping-season-global-port-tracker-descartes-imports-cargo-1239335219/
• Descartes Systems Group — Global Shipping Report resource center (October 2026), October 8, 2026. https://www.descartes.com/resources/global-logistics-shipping-report-resource-center
• Reuters — US ocean container imports set new record for September, Descartes says, October 8, 2026. https://www.reuters.com/world/china/us-ocean-container-imports-set-new-record-september-descartes-says-2026-10-08/
• Port of Los Angeles — Port of Los Angeles posts best three-month cargo stretch (August 2026), September 9, 2026. https://portoflosangeles.org/references/2026-news-releases/news_090926_aug_cargo
• The Loadstar — Record Long Beach volumes mask trouble ahead as capacity tightens, warns LB boss, September 21, 2026. https://theloadstar.com/record-long-beach-volumes-mask-trouble-ahead-as-capacity-tightens-warns-lb-boss/
• The Dwell (Port of Los Angeles and Port of Long Beach data) — Rail dwell: Los Angeles / Long Beach on-dock rail import containers, October 6, 2026. https://the-dwell.com/boxdwell/rail-dwell-la-long-beach
• The Dwell — Long Beach rail outbound drops 17%, nine-plus-day boxes clear faster, October 6, 2026. https://the-dwell.com/
• The Dwell — LA/Long Beach friction read lifts to some pressure, September 22, 2026. https://the-dwell.com/issues/2026-09-22
• Hellenic Shipping News (PMSA data) — Rail-destined container dwell times at LA/LB ports reach 2026 high amid resilient demand, September 21, 2026. https://www.hellenicshippingnews.com/rail-destined-container-dwell-times-at-la-lb-ports-reach-2026-high-amid-resilient-demand/
• gCaptain (Georgia Ports Authority data) — Port of Savannah Sets September Container Record as Imports Rise, October 7, 2026. https://gcaptain.com/port-of-savannah-sets-september-container-record-as-imports-rise/
• Sea-Intelligence — Global Schedule Reliability Continues to Plummet in August, September 29, 2026. https://www.sea-intelligence.com/press-room/410-global-schedule-reliability-continues-to-plummet-in-august
• PortNews (reporting Sea-Intelligence) — Asia container ship schedule reliability falls to 32.3% as Shanghai drops to 12.2%, September 30, 2026. https://en.portnews.ru/news/397671/
• Xeneta — What it takes to defend a 2027 freight budget, September 23, 2026. https://www.xeneta.com/blog/2026-budget-season-roundtables
• Beacon — The Monthly Freight Briefing, October 2026, October 2, 2026. https://beacon.com/resources/october-2026-schedules-broke-while-volumes-held
• FreightWaves via Yahoo Finance — No mention of U.S.-China ship taxes in trade truce, September 28, 2026. https://finance.yahoo.com/economy/policy/articles/no-mention-u-china-ship-134527500.html
• IndexBox — US and China Extend Trade Truce to January 10, 2027, Bessent Says, September 24, 2026. https://www.indexbox.io/blog/us-and-china-extend-trade-truce-to-january-10-2027-bessent-says/
• Office of the U.S. Trade Representative — Notice of Action: Section 301 investigation of China's targeting of the maritime, logistics and shipbuilding sectors (fee schedules), April 17, 2025. https://ustr.gov/sites/default/files/files/Press/Releases/2025/301%20Ships%20-%20Action%20FRN%204-17.pdf
• Office of the U.S. Trade Representative — Notice of suspension of Section 301 ships action, November 2025. https://ustr.gov/sites/default/files/files/Press/Releases/2025/Section%20301%20Ships%20FRN%20Action%20Suspension%2011-9-25%20Final.pdf
• FreightWaves — Truckload Spot Rates Keep Rising, But Demand Isn't… Why?, October 5, 2026. https://www.freightwaves.com/news/truckload-spot-rates-keep-rising-but-demand-isnt-why
• FreightWaves — Trucking capacity crisis: rejections up 4x on same volume, October 6, 2026. https://www.freightwaves.com/news/trucking-capacity-crisis-rejections-up-4x-on-same-volume
• FreightWaves — Is Trucking Capacity Coming Back? Why New Capacity Isn't Entering the 2026 Freight Market, October 7, 2026. https://www.freightwaves.com/news/is-trucking-capacity-coming-back-why-new-capacity-isnt-entering-the-2026-freight-market
• MegaCorp Logistics (SONAR data) — MegaCorp Market Pulse: September 28–October 4, 2026, September 30, 2026. https://www.megacorplogistics.com/megacorp-market-pulse-september-28-october-4-2026/
• U.S. Bank — U.S. Bank and DAT: Contract and spot truck freight rates diverge, October 1, 2026. https://ir.usbank.com/news-events/news/news-details/2026/U-S--Bank-and-DAT-Contract-and-spot-truck-freight-rates-diverge/default.aspx
• Trucking Industry News (reporting FTR and Truckstop) — Spot Market Rates Post Solid Gains in the Latest Week, October 5, 2026. https://truckdrivernews.com/spot-market-rates-post-solid-gains-in-the-latest-week/
• Rose Rocket (reporting DAT and Cass) — When Cass Turns Positive After 42 Months, Peak Season Still Punishes Loose Cover, September 23, 2026. https://www.roserocket.com/blog/when-cass-turns-positive-after-42-months-peak-season-still-punishes-loose-cover
• Cass Information Systems — The Freight Industry's Essential News Roundup – September 2026, September 26, 2026. https://www.cassinfo.com/blog/the-freight-industrys-essential-news-roundup-september-2026
• Transport Topics — Trucking's recovery continues to hinge on tighter capacity, September 28, 2026. https://www.ttnews.com/articles/ata-tonnage-august-2026
• Transport Topics — September Class 8 truck orders lose pace on EPA uncertainty, October 6, 2026. https://www.ttnews.com/articles/class-8-orders-september-2026
• FreightWaves — Took awhile to happen but trucking jobs are now more than year ago, October 2, 2026. https://www.freightwaves.com/news/took-awhile-to-happen-but-trucking-jobs-are-now-more-than-year-ago
• FreightWaves via Yahoo Finance (Logistics Managers' Index) — Transportation prices surge as capacity tightens further in September, October 6, 2026. https://finance.yahoo.com/economy/articles/transportation-prices-surge-capacity-tightens-134745326.html
• U.S. Energy Information Administration — Gasoline and Diesel Fuel Update, October 6, 2026. https://www.eia.gov/petroleum/gasdiesel/
• CCJ — LTL Carrier Q3 2026 Updates: Old Dominion & Saia Post Gains, September 4, 2026. https://www.ccjdigital.com/economic-trends/freight-demand/article/15834158/ltl-carrier-q3-2026-updates-old-dominion-saia-post-gains
• Old Dominion Freight Line — Old Dominion Freight Line, Inc. Announces General Rate Increase, September 21, 2026. https://ir.odfl.com/news-events/press-releases/detail/350/old-dominion-freight-line-inc-announces-general-rate
• XPO — XPO Provides North American LTL Operating Data for August 2026, September 3, 2026. https://investors.xpo.com/news-releases/news-release-details/xpo-provides-north-american-ltl-operating-data-august-2026
• Trucking Dive via Yahoo Finance — Shipment fluctuations vary across LTL carriers in mid-Q3 updates, September 24, 2026. https://finance.yahoo.com/small-business/articles/shipment-fluctuations-vary-across-ltl-134500573.html
• Intermodal Association of North America — U.S. intermodal freight volume remains elevated in October, October 8, 2026. https://www.intermodal.org/article/us-intermodal-freight-volume-remains-elevated-in-october
• Railway Age (AAR data) — AAR Week 39: Volume Still Climbing, Overall, October 7, 2026. https://www.railwayage.com/freight/class-i/aar-week-39-volume-still-climbing-overall/
• Union Pacific — Key Performance Metrics, October 3, 2026. https://investor.unionpacific.com/key-performance-metrics
• Norfolk Southern — Weekly Performance Reports, October 2, 2026. https://norfolksouthern.investorroom.com/weekly-performance-reports
• C.H. Robinson — Intermodal and U.S. Ports Freight Market Update, October 2026, October 1, 2026. https://www.chrobinson.com/en-gb/resources/insights-and-advisories/north-america-freight-insights/oct-2026-freight-market-update/intermodal/
• Xeneta — Shippers seek airfreight rates 'floating mechanisms' before committing to long-term capacity as demand grows 6% year-on-year in September, October 2, 2026. https://www.xeneta.com/news/shippers-seek-airfreight-rates-floating-mechanisms-before-committing-to-long-term-capacity-as-demand-grows-6-year-on-year-in-september
• IATA — Air Cargo Demand Grows 4.4% in August, September 29, 2026. https://www.iata.org/en/pressroom/2026-releases/09-29-air-cargo-demand-grows-august/
• WorldACD — WorldACD Weekly Air Cargo Trends 2026 – week 39, October 5, 2026. https://www.worldacd.com/trend-reports/weekly/worldacd-weekly-air-cargo-trends-2026-week-39/
• Air Cargo News (TAC Index) — Airfreight rates edge up in September, October 6, 2026. https://www.aircargonews.net/data/2026/10/airfreight-rates-edge-up-in-september/
• The Loadstar — Saudi disruption squeezes air cargo capacity as peak looms, October 9, 2026. https://theloadstar.com/saudi-disruption-squeezes-air-cargo-capacity-as-peak-looms/
• European Commission — EUR 3 customs duty: VAT guidelines (Council Regulation (EU) 2026/382), June 16, 2026. https://vat-one-stop-shop.ec.europa.eu/eur-3-customs-duty-vat-guidelines-2026-06-16_en
• HLPFI (Toepfer Transport) — Toepfer Transport's monthly multipurpose shipping rate update, September 14, 2026. https://www.heavyliftpfi.com/shipping/2026/09/14/toepfer-transports-monthly-multipurpose-shipping-rate-update/
• El Economista — Puerto de Manzanillo opera a 80% de su capacidad sin saturación, September 29, 2026. https://www.eleconomista.com.mx/estados/puerto-manzanillo-opera-80-capacidad-saturacion-20260929-836019.html